


Cloud technologies and DevOps both started gaining traction around the same time. No one can say whether one helped cause the other, but they go together quite well. I speculate that it would be hard to implement DevOps principles without the advances that cloud technologies have brought about. Continuous delivery is a critical automation practice under the DevOps umbrella. You have experienced slow-to-change legacy code. You have experienced deployments gone wrong. You have experienced spending an entire weekend just to roll out a small change. You have experienced the excruciating pain associated with manually managing configuration management. DevOps practices solve this pain. Read on to:
- Understand the DevOps movement
- Set up continuous delivery
- Integrate the Dev with the Ops
- Scale continuous delivery with cloud technologies
DevOps: The New Culture in Software
DevOps is a term representing the convergence of development and operations. Both the development and operations communities like to own the term, so it has accumulated multiple meanings. With the Agile Manifesto, developers have jettisoned annual software releases for processes that allow releasing software multiple times per day. To accomplish this, teams use rigorous suites of automated tests to ensure that every change to the software is a solid step forward rather than an accidental step backward.
DevOps, from an operational perspective, represents the next step in IT operations for complex software systems. Over the years, the evolution of Storage Area Networks (SAN) and the advent of virtualization technology have transformed the daily work of operations departments from one of maintaining physical hardware to one where they expect reliability from the infrastructure and can increase the level of differentiated value brought to the organization.
Both departments are proud of the advances made and are ready to move toward the other to “help” the other side improve. This causes great differences in the described definition of the term when speaking with representatives of either group.
Sophisticated companies, like Facebook and Spotify, have enlisted new techniques that enable development and operations to merge into a single work group where those who develop an application are also the ones who operate it. To achieve this end, teams must cross-train and also adapt to change as well as demand adoption of a new normal, where servers are not something to be named and cared for, like pets, but rather are resources to be numbered and used, like cattle, to use the analogy of Microsoft's Jeffrey Snover at his famous Ignite 2015 presentation.
The latest innovation is to have a single work group where those who develop an application are also the ones who operate it.
Most people now agree that DevOps is a continuation of the Agile movement's work and the innovations of Lean manufacturing into the world of server and datacenter operations. Cloud technologies, like Azure, aid the implementation of DevOps practices by providing infrastructure that behaves like software. Software defies the physics to which other industries must conform because it can be created, modified, destroyed, and duplicated without having to follow the well-known principle of conservation of mass, popularized by Antoine Lavoisier. Likewise, the cloud moves infrastructure (historically difficult to procure, install, configure, and operate), into a state where the physical nature is sufficiently abstracted so that you perceive that servers can now be easily created, modified, destroyed, and duplicated by a mere button click or a single line of code. In this new working environment, the difference between the code and the environment shrinks.
In a cloud world, everything can be represented as code and runs easily. When everything can be performed with code, everything can be automated. The world of IT operations, which includes teams of people manually setting up servers, manually watching them, and manually fixing them, is now one where these same activities are performed through code automation.
Continuous Delivery Allows Entry into the DevOps World
Since 2005, the word “continuous” has changed how teams develop, deploy, and run software. Starting with the impactful book, “Continuous Integration: Improving Software Quality and Reducing Risk” by Paul Duvall, teams have increasingly moved from a world where work is done in large batches to a world where the same work is done in much smaller batches while being integrated with work adjacent to it. Many can remember a workflow where developers were assigned different parts of an application. They wrote code for weeks on end. Some might check the code in. Others might not. Regardless, the code wasn't integrated even if it was checked in. The Agile movement brought with it technical practices from Extreme Programming, such as continuous integration and test-driven development. Now, teams that profess to be using Agile are known to have continuous integration servers that compile and run the tests of the software with every code check in. With the cloud, Agile has moved beyond how to write the appropriate code, and the new DevOps movement (new as of 2010) carries the word “continuous” into new frontiers. These are called continuous delivery and continuous deployment. Figure 1 shows the progression of sophistication that exists as teams implement these practices.
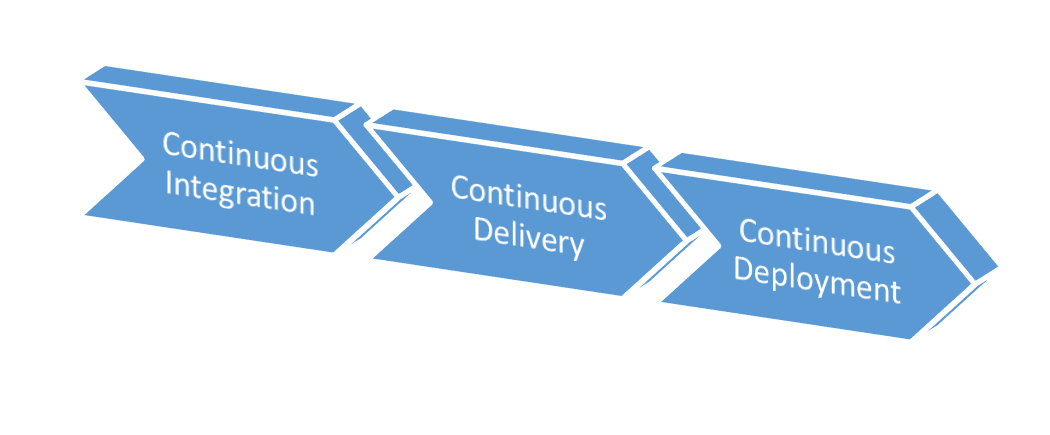
Continuous deployment is the practice of deploying every code check-in to production automatically after that change is run through batteries of automated tests and validations. For highly sophisticated companies whose livelihood relies on their software practices, continuous deployment is a desirable process because it results in the ultimate speed to market. It comes with more risks and product management defects, but these risks are managed. Companies such as Netflix and Facebook have shown innovation in this area and have demonstrated that continuous deployment is possible.
Using the same technical practices as continuous deployment, continuous delivery allows the constant flow of code changes through test and validation environments to various internal organizational customers. For most companies, continuous delivery sits nicely in the middle of the process continuum, as shown in Figure 1, and combines automated and non-automated processes while updating and changing the software being released. Internal customers can add a human decision to these changes before they're deployed to production. This might include single or multiple manual approval processes. Regardless of the number of approval or manual test steps, the environment includes sufficient automation so that the manual steps only include items that the organization deems are human judgement calls. Every other verification on the release is fully automated. Continuous delivery is also a great practice to employ along the way to continuous deployment because the difference between the two is the existence or absence of manual approval. Most organizations that employ continuous integration are ready to automate the technical aspects of software deployments to production and other environments, but it's quite a process to build up the sophistication required to fully rely on automation verifying that the code works properly once it gets to production.
The Required Mindset
Continuous delivery is a DevOps process. To implement it well, you must have the proper mindset. This mindset is guided by principles taken from the Agile Manifesto, lean software development, and the CALMS DevOps acronym.
The second value of the Agile Manifesto is “working software over comprehensive documentation.” With early agile processes including scrum meetings, teams were able to quickly produce software that could be demonstrated to an internal customer. Because changing software in production was so difficult, demonstrable software was accepted as “good enough” for the working software principle. With the flexibility of cloud infrastructure, including private cloud infrastructure, teams employing this Agile value can truly deliver working software in production quite frequently. An interesting outcome with continuous delivery, as you'll see, is that it doesn't just produce working software, but it also produces documentation that's quite comprehensive because the documentation is automated.
Lean software development was popularized by Mary and Tom Poppendieck in their popular book “Lean Software Development.” The lean principles are:
- Eliminate waste
- Amplify learning
- Decide as late as possible
- Deliver as fast as possible
- Empower the team
- Build quality in
- See the whole
An interesting combination includes the principles regarding quality and speed (delivering good product as fast as possible). Practitioners of continuous delivery have found that by achieving speed, they also achieve quality. They find that speed is only achieved by eliminating bottlenecks, errors, bugs, and other types of waste. Once this is accomplished, the result is a process that builds-in high levels of technical quality. I'll point out that this does not impact product management quality, which is a discipline outside of this technical practice.
In the DevOps community, which includes many groups and the popular conference series, DevOpsDays, the CALMS acronym has been a guiding idea. It's a fantastic acronym and gives a sense that with DevOps, software and production operations are not stressful: DevOps “CALMS” us down. The CALMS acronym stands for:
- Culture
- Automation
- Lean
- Measurement
- Sharing
At the first DevOpsDays conference in 2010, John Willis and Damon Edwards, co-hosts of the popular DevOps Cafe podcast, coined the term CAMS. Then, Jez Humble suggested adding Lean to the list, and a great term was born, eliciting that using properly applied DevOps, IT operations could be sustainable.
Continuous delivery is one piece of the DevOps puzzle made easy with the cloud. And it's an implementation of both the Automation and Lean principles in CALMS. I also believe that it alters behavior and has a positive impact on organizational culture.
Introducing the Infrastructure
The major pieces of continuous delivery infrastructure are shown in Figure 2.
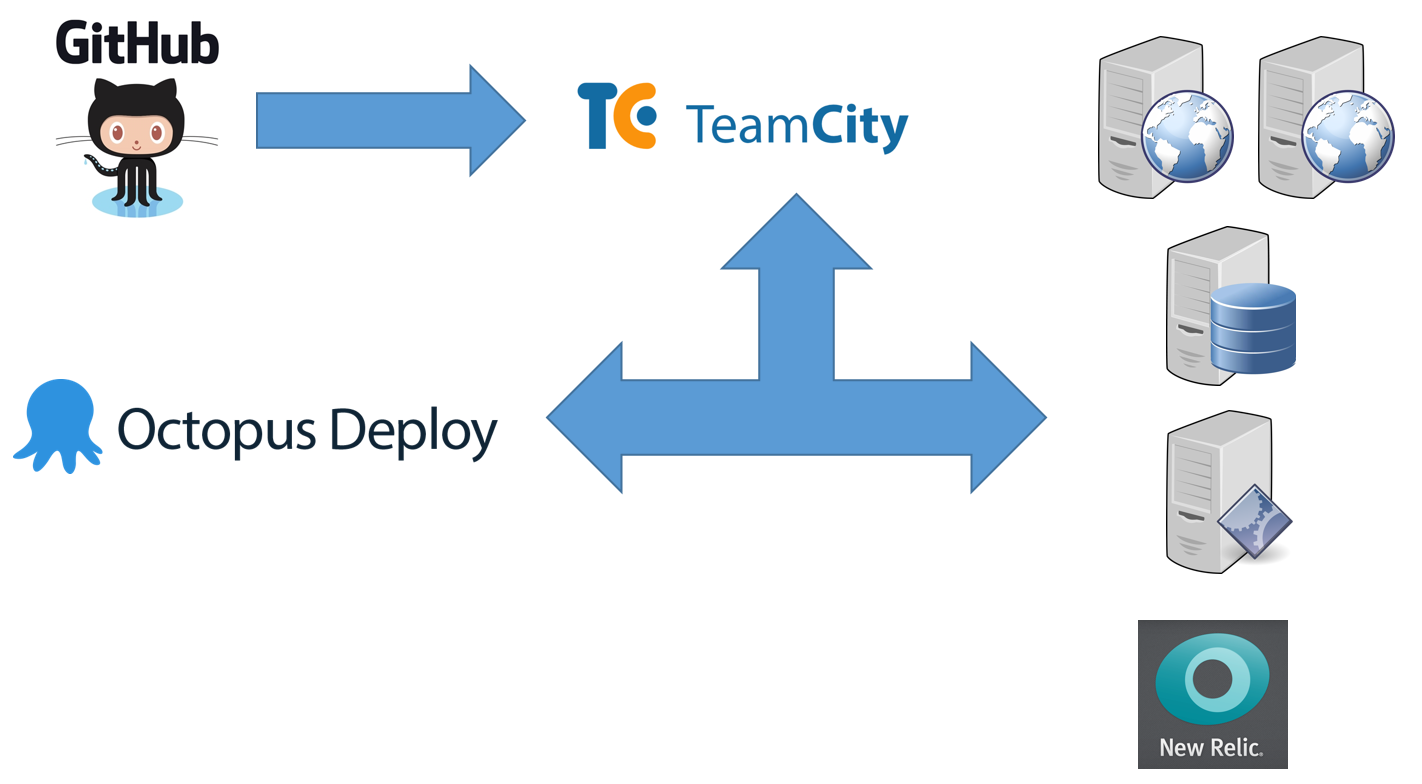
The critical pieces are:
- Git source control
- JetBrains TeamCity build server
- Octopus Deploy server
- Environment management servers
- Target environment servers
- Environment monitoring system
I have chosen these infrastructure pieces because they work very well together. Microsoft's NuGet.org team also uses this same combination of products and tools. You can see an interview with Microsoft engineer Andrew Stanton-Nurse where he describes how these same tools are used at Microsoft to produce a world-class result for a fast-moving and high-scale software system. The interview can be found at https://octopus.com/blog/deploying-nuget.org.
Let's walk through each piece, starting with where you store the source code. You can retrieve the code at https://github.com/ClearMeasureLabs/ClearMeasureBootcamp. This is a Git repository hosted on GitHub, and it's used for this article. This application is one of several that I use for training and demonstrations, and it's constantly enhanced as need demands it. Figure 3 shows the directory structure for the repository.
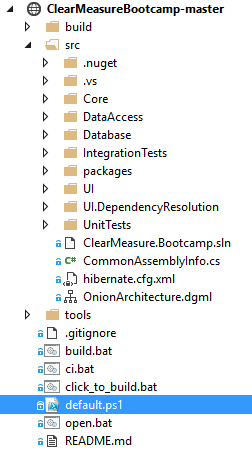
You'll notice the default.ps1 file in the root. This is the psake build script that I'll cover later. There is a helper file called ci.bat that's configured in TeamCity, and which performs the continuous integration process. In TeamCity, you have a build project with four build configurations to model the delivery pipeline. Figure 4 shows the TeamCity dashboard with build configurations.
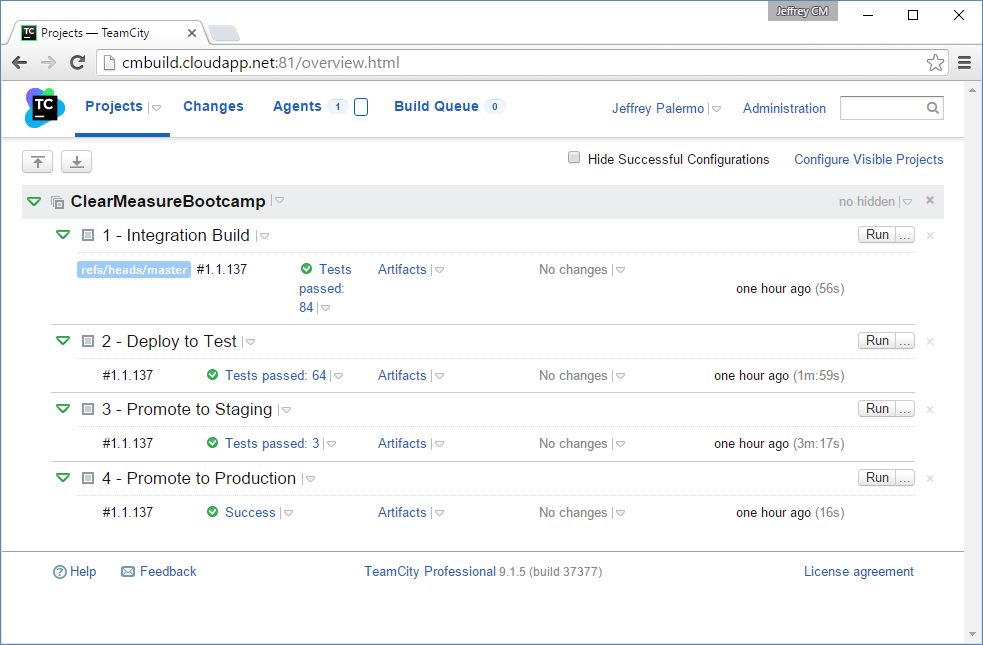
Notice that every build is tagged with a three-part version number using an implementation of Semantic Versioning. You can see the definition of Semantic Versioning at http://semver.org/. As you'll see later, you use the continuous integration build to establish a version number, and that number is carried throughout the rest of the process.
Automating the Deployment
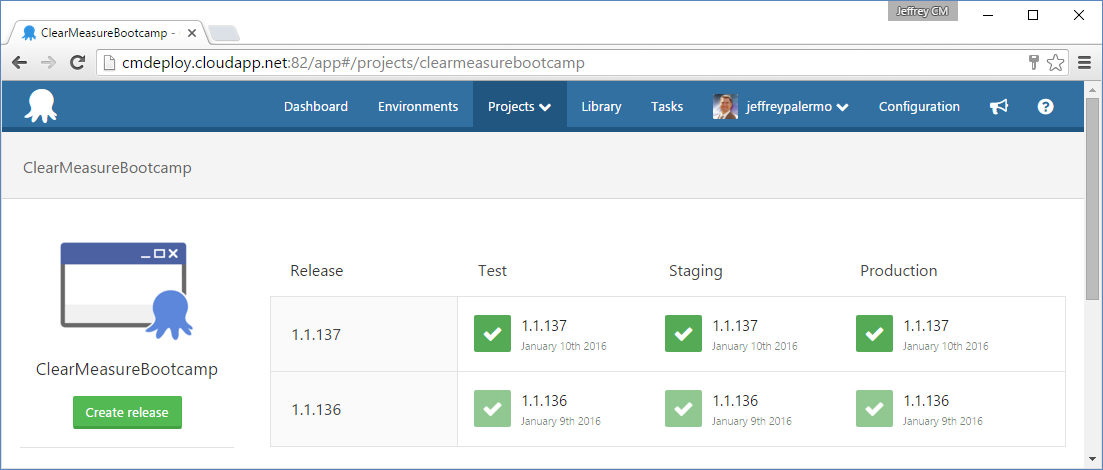
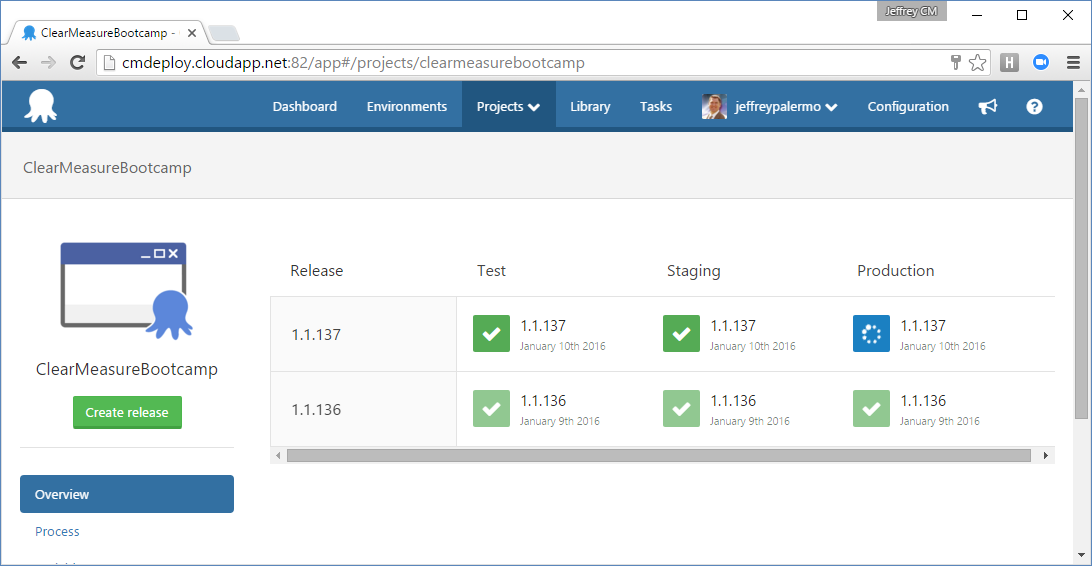
The next piece of infrastructure is the Octopus Deploy server. Figure 5 shows the dashboard for the ClearMeasureBootcamp project.
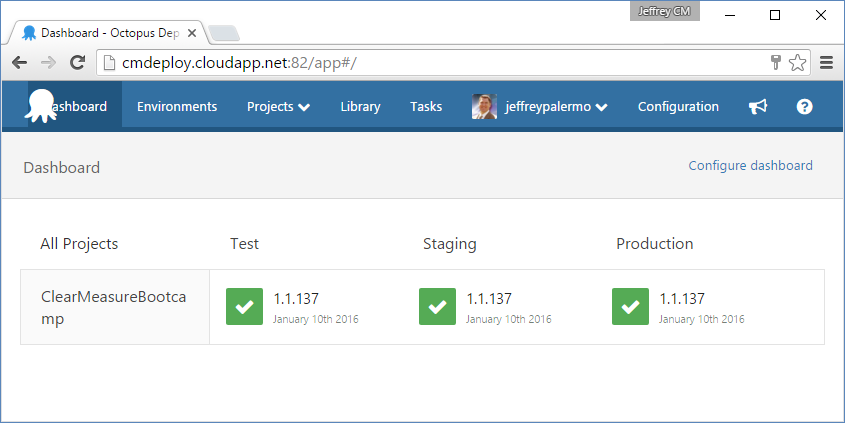
You can see that Octopus Deploy keeps track of which versioned releases have made their way to various environments. You use TeamCity and Octopus Deploy together because they work cohesively and come with built-in integration. In full disclosure, Clear Measure is a JetBrains and Octopus Deploy partner.
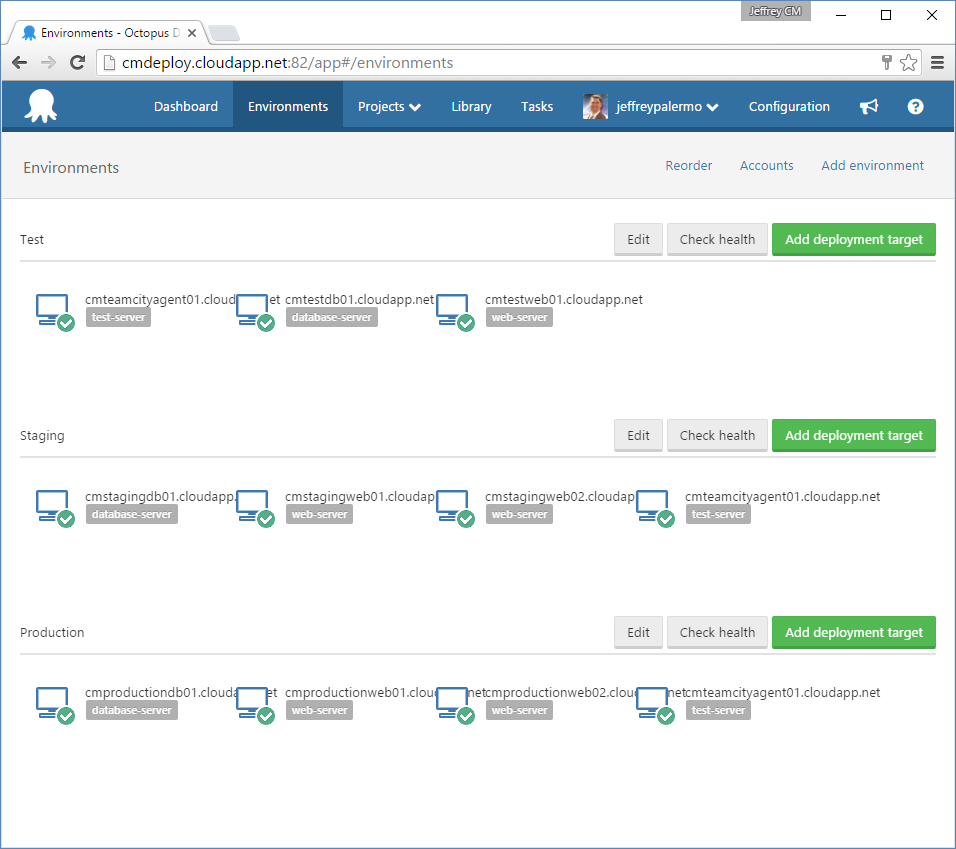
Environment management servers can be called by other names, and they're the servers that exist specifically to be able to deploy to and manage the target environment
Environment management servers can be called by other names, and they're the servers that exist specifically to be able to deploy to and manage the target environment. They're also the launch pad for automated tests that are appropriate for that environment. For example, in production, these servers launch the basic smoke tests to ensure that the production environment happened smoothly. Figure 6 shows the environment configuration, including the management server, cmteamcityagent01.cloudapp.net, as well as the servers that make up each environment.
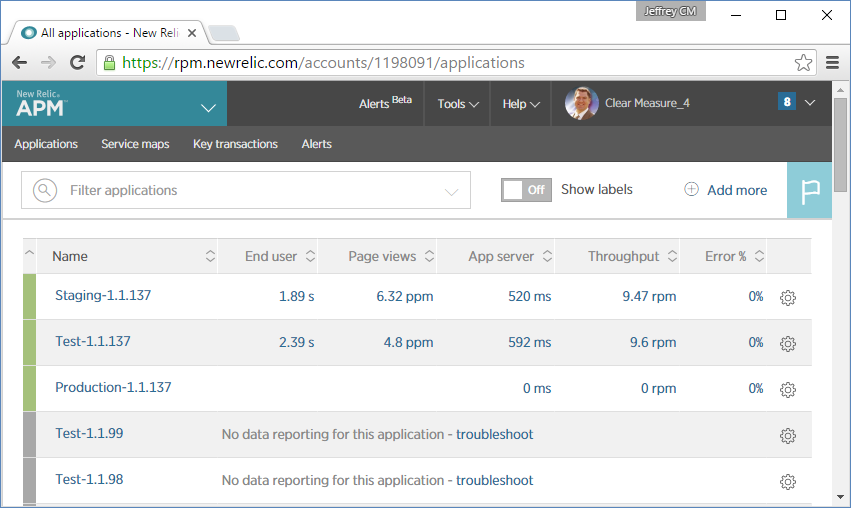
Finally, you're using New Relic for monitoring. Figure 7 shows a New Relic dashboard where you can keep tabs on all the versions of the application as they move through the deployment pipeline.
For this demonstration, I'm using virtual machines (VMs) in Windows Azure, but I chose to use all IaaS (Infrastructure as a Service) features and didn't make use of any PaaS (Platform as a Service) features such as Web Apps or SQL databases. In this way, you can employ these techniques regardless of cloud platform. For the sake of this article, I'm assuming a deployment pipeline that includes three environments.
- Test
- Staging
- Production
Figure 8 depicts the lifecycle I've configured for the order of environments in Octopus Deploy.
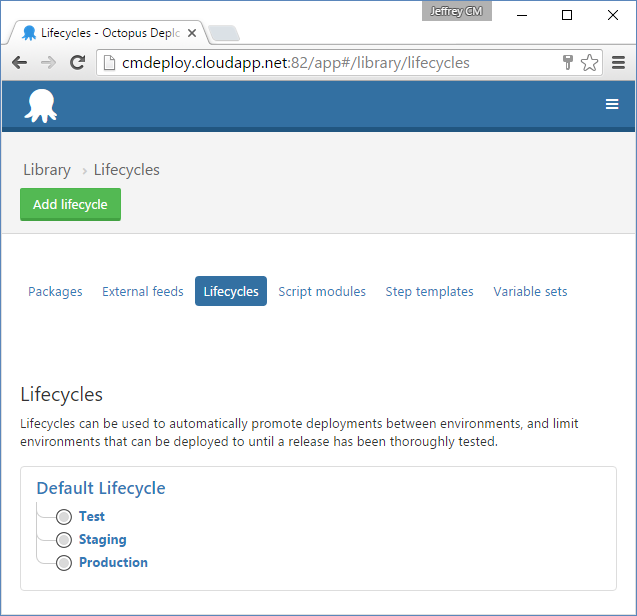
This process creates a release automatically once the integration build completes successfully within Team City. It automatically deploys that release to the test environment and runs the functional tests that I have designed for that environment. Upon success of those tests, it automatically deploys to staging and runs the acceptance test suite, which includes leaving the environment with sufficient data for the clients to fully test and validate the new release in an environment that's a good clone of production. The automation then initiates a deployment to production but waits for manual approval by the client. Once the client has a chance to look at the release in the staging environment, he can approve deployment of that release into production by clicking a single button in Octopus Deploy (or informing an appropriate technical person that the release is approved for deployment).
Application Configuration
The application I'm using is a very simple expense-reporting application. It includes elements like the Onion Architecture layers, and other elements that you'll find in your own applications, such as:
- Separate projects for separate concerns
- A UI Project that stands with only a single reference (to Core)
- Data access with NHibernate
- NUnit unit tests and integration tests
- HTTP Handlers
- The Bootstrap CSS/JS library
- StructureMap for dependency injection
- AliaSQL, a database migration tool
- A psake build script
- A custom workflow engine
Figure 9 shows the dependency structure of the application.
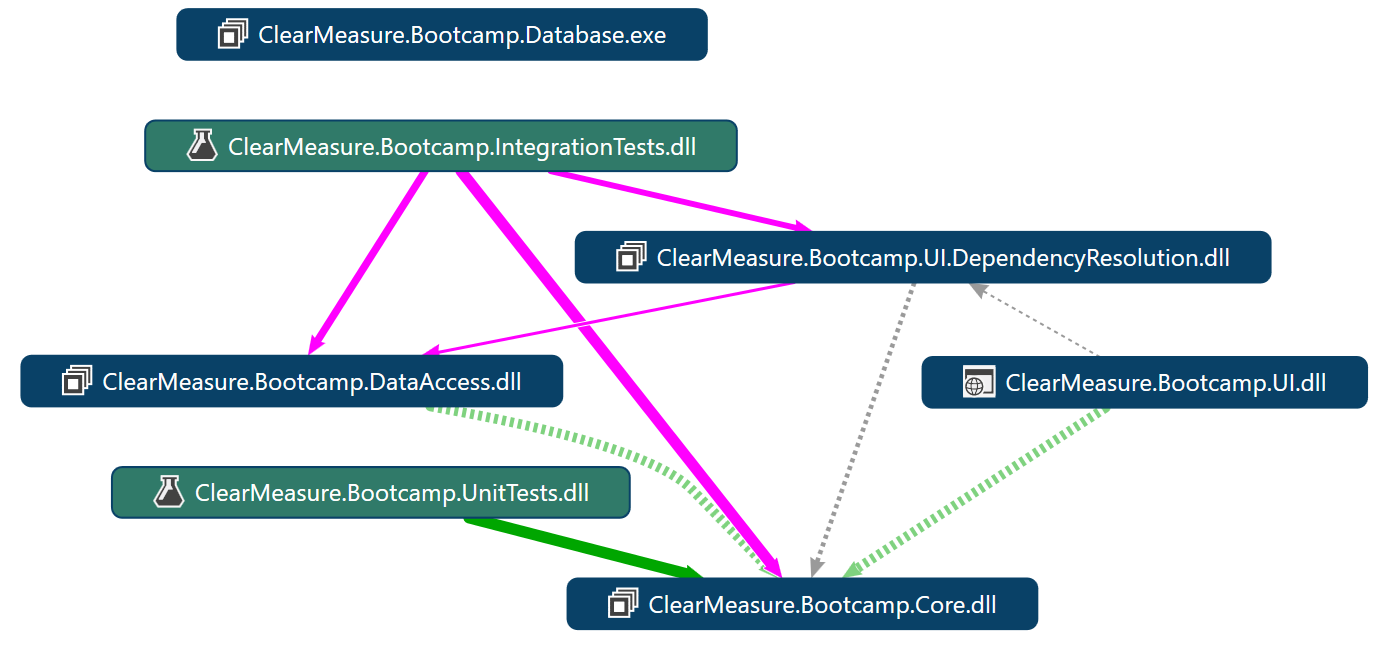
For deployment of this application, the two application components are the SQL Server database and the Web application. In order to facilitate continuous delivery, you also deploy some tests to be run in the various environments. There are multiple components that need to be deployed to the correct environments including:
- The Web application
- The database schema
- The tests
Figure 10 shows the progression of possible tests in a continuous delivery pipeline.
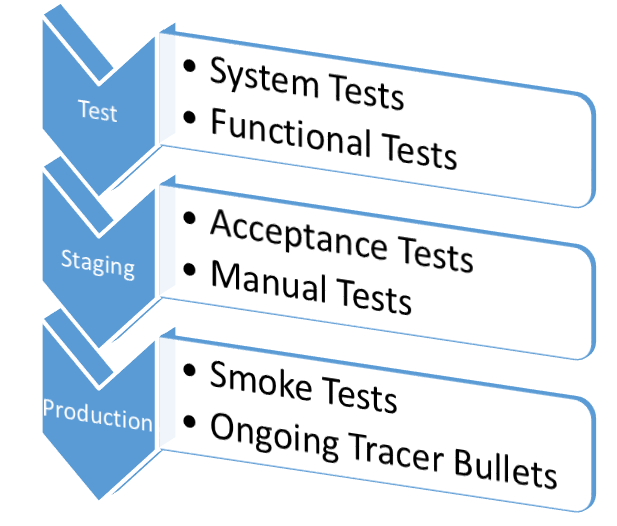
The number of test suites defines the number of steps in your continuous delivery pipeline. The goal is to run enough tests of various types so that you literally squeeze out the possibility for a problem to exist by the time you deploy to production. This won't happen in a big bang on the first try. But by setting up this infrastructure and continuously adding more and more tests every time something slips through, you'll reach a point where problems slip infrequently, and when they do, they're small problems rather than showstoppers.
The goal is to run enough tests of various types so that you literally squeeze out the possibility for a problem to exist by the time you deploy to production.
In order to set the application up for deployment via Octopus Deploy, you need to install a NuGet package called OctoPack into the projects in Visual Studio that represent units of deployment. Examples of this are:
- Web application projects
- Windows service projects
- Console application projects
- Test projects
- Any project that houses a process to be run during deployment
The most obvious example of a project that needs OctoPack is the UI project. You install OctoPack easily by running the following snippet of script in the Package Manager Console:
PM> Install-Package OctoPack -Project UI
Attempting to gather dependencies information for package 'OctoPack.3.0.46' with respect to project 'UI', targeting '.NETFramework,Version=v4.6'
Added package 'OctoPack.3.0.46' to 'packages.config'
Executing script file 'C:\working\ClearMeasureBootcamp-master\src\packages\OctoPack.3.0.46\tools\Install.ps1'
Successfully installed 'OctoPack 3.0.46' to UI
OctoPack doesn't cause any new runtime dependency to be added to your code. It simply adds a hook in your project's .csproj file, which is a way to execute a command at the end of an msbuild.exe project so that your application can be bundled into a deployment package. The following is what is added when you install the OctoPack NuGet package.
<Import Project="..\packages\OctoPack.3.0.46\tools\OctoPack.targets"
Condition="Exists('..\packages\OctoPack.3.0.46\tools\OctoPack.targets')" />
<Target Name="EnsureOctoPackImported"
        BeforeTargets="BeforeBuild"
        Condition="'$(OctoPackImported)' == ''">
  <Error Condition="!Exists(...) And $(RunOctoPack))"
         Text="You are trying to build..." />
  <Error Condition="Exists(...) And $(RunOctoPack))"
         Text="OctoPack cannot be run..." />
</Target>
For the application, I've installed OctoPack into the following projects:
- UI
- Database
- IntegrationTests
The UI project is the Web application. The Database project runs the SQL Server database migrations tool so that schema upgrades can happen on some environments and so that the database can be built from scratch on first-level test environments. The IntegrationTests project contains the full system functional tests as well as the acceptance tests that are run in the staging environment. In each of the projects where you install OctoPack, you'll be modifying the compile step in the build script to have MSBuild produce Octopus Deploy Nupkg files to use for numbered releases. In order to control the packaging step, I've added .nuspec files to each of the relevant projects. The following is the source for the UI.nuspec file.
<?xml version="1.0" encoding="utf-8"?>
<package xmlns="http://schemas.micros...">
    <metadata schemaVersion="2">
    <id>UI</id>
    <version>9.9.9</version>
    <authors>Clear Measure</authors>
    <projectUrl>http://git....</projectUrl>
    <requireLicenseAcceptance>
        false</requireLicenseAcceptance>
    <description>...</description>
    </metadata>
    <files>
        <file src="bin\*.*" target="bin" />
    </files>
</package>
The .nuspec file is optional, but for all practical applications, you'll need it in order to control the files that are added to the release package. In this application, you use the very common Post-Build Event feature in Visual Studio to copy some additional files to the /bin folder for use by the Inversion of Control container, StructureMap, at runtime. These files are required to be present in the /bin folder when the application runs, even though you don't maintain a compile-time dependency on them.
Finally, the AssemblyInfo.cs file is specially formulated. In fact, if you recall Figure 3, you have a single CommonAssemblyInfo.cs file for the entire solution. This file is compiled into each assembly using Visual Studio linked files. This file is regenerated by the build script on the TeamCity continuous integration server. In this way, the build server established the build number, adhering to Semantic Versioning, and then all assemblies have that number embedded at compile time. That build number, which looks like MAJOR.MINOR.PATCH, or 1.1.137, is also used as the NuGet package release number. With the same number labeling all the relevant artifacts, you maintain strict records of what code, what packages, and what files belong to a labelled version.
Setting Up the Deployment Pipeline
You have Octopus Deploy set up on cmdeploy.cloudapp.net. This server doesn't have to be in the same subnet or even the same data center as your other server environments. The Octopus Deploy server acts as a host server, and it only must know where the target environment servers are. These servers must have a small agent installed known as a Tentacle. These Tentacles are the processes that run any deployment actions locally on the target server. Figure 11 shows my project dashboard with environments configured inside Octopus Deploy.
For this example, I have a very simplified continuous deployment pipeline. I have the following target environments configured:
- Test: a simplified, non-Web farm environment with a scaled-down Web and database server
- Staging: a scaled-down VM-based Web farm using the same Web farm configuration as production
- Production: full-strength, large VMs configured with a two node Web farm and separate database server
When you're deciding how to design your deployment pipeline, you'll need to decide how many types of system tests you already have and what types you intend to create. Your design is based around your test suites. The shape of the environments flows from the test suite design. In the case of this example, you have some full system functional tests that you run in your test environment. The staging environment includes some acceptance tests, and then the pipeline leaves the staging in a state suitable for some manual exploratory testing, so you have a step that seeds the database with a known set of data with which the client is familiar. The production environment is configured only with smoke tests designed to ensure that the deployment process completed successfully and started all components of the application. There's nothing worse than putting a new release in production only to have a customer or user try to use it and receive an error!
Jez Humble defined the concept of a deployment pipeline in his book, “Continuous Delivery: Reliable Software Releases through Build, Test, and Deployment Automation”.
Octopus Deploy Configuration
As you're configuring your environments in Octopus Deploy, you'll add multiple deployment targets to a single environment. Figure 12 shows the options for adding a new environment.
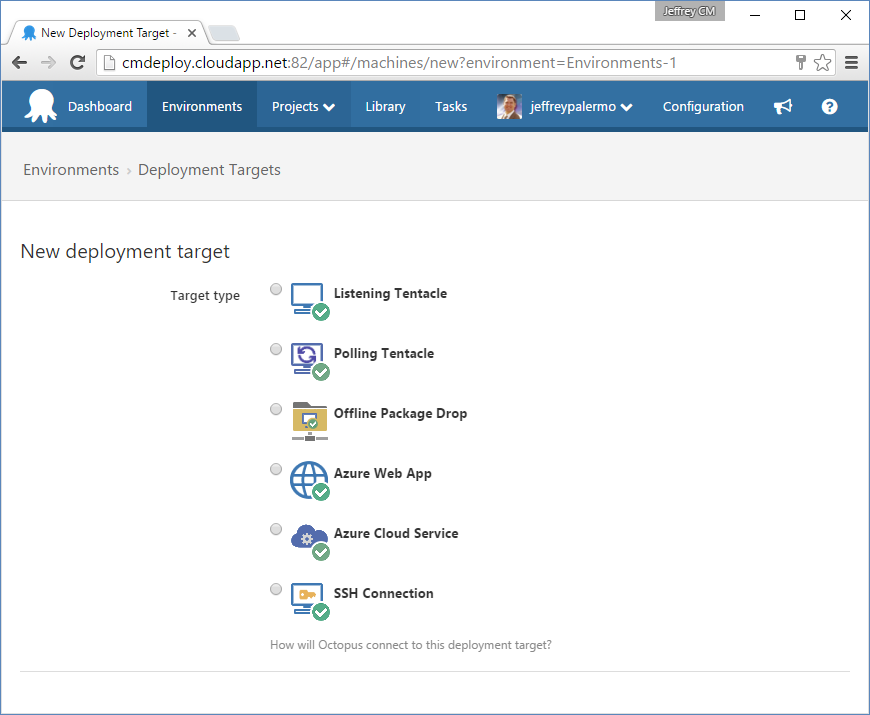
The options for a deployment target are:
- Listening Tentacle
- Polling Tentacle
- Offline Package Drop
- Azure Web App
- Azure Cloud Service
- SSH Connection
If at all possible, you should use the Listening Tentacle. This is the vendor's recommended option for use with the product, and it provides the most robust control over deployments. The Azure options are there for backward compatibility, but expect them to be made obsolete in the future as they've been embedded into the Listening Tentacle as deployment steps. When you add a server that an application component will be installed to, you'll need to retrieve the cryptographic thumbprint that was generated when you installed the Tentacle agent on the target server. The only network requirement is that the Octopus Deploy host can reach the chosen port over the network. This way, releases can flow and deploy freely, but only from the specified Octopus Deploy server.
Once you have added a target server, you provide some information about it. Figure 13 shows the settings.
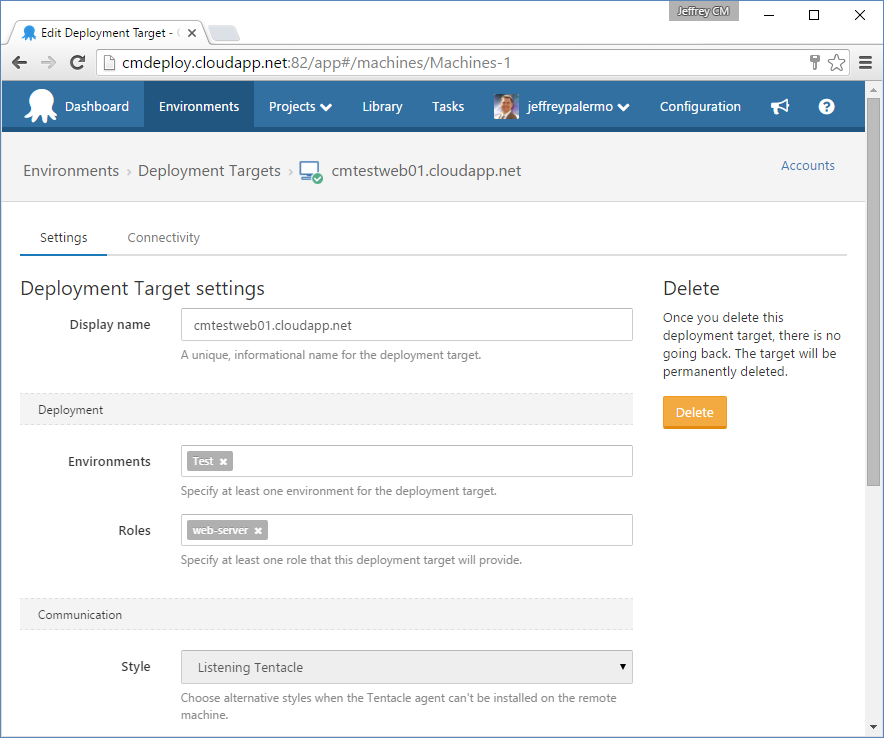
You can reuse a particular target server for multiple environments, and it can be the target for multiple application components. The concept of a Role in Octopus Deploy determines the components installed. Take care to provide the DNS name of the server in the Display Name field. When you craft deployment scripts and other settings, this setting fills the #{Octopus.Machine.Name} variable. And if you ever use this variable to craft addresses to reach the computer, you'll need it to be the actual DNS name or a network name suitable for the use.
Even though the field in Deployment Target settings says “Display name,” it's actually used to populate the
#{Octopus.Machine.Name}variable at deploy time. It's best to use a full DNS name in this field rather than a friendly name.
Once you have the environments configured and the servers laid out, it's time to configure the deployment process. The deployment process uses the concept of roles that you established within the environments. The production environment has two Web servers and the test environment has only one. With Octopus Deploy, the deployment process can be exactly the same, and the tool takes care of the situation where a particular role exists on multiple target servers. Figure 14 shows the deployment process for the Octopus Deploy project.
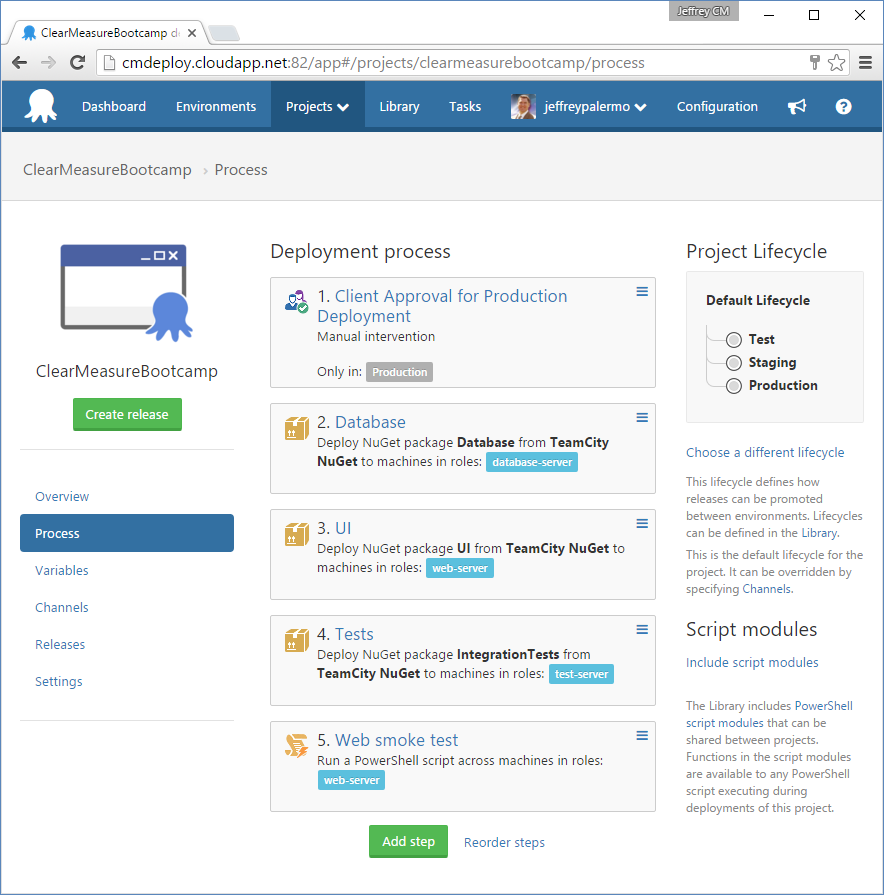
The process, regardless of environment has the following steps:
- Client approval: is only enabled if the environment is in production
- Database: migrates the SQL Server database schema
- UI: provisions an IIS website and deploys the Web application
- Tests: deploys test assets to the management server inside the environment
- Web smoke test: runs a PowerShell script crafted to run the Web application through its paces to ensure that it's online.
You can see which steps in the process execute on which roles and environments by the visual tags displayed on the screen. The UI step in the process is the most interesting step because it uses some extra Octopus Deploy features. Figure 15 shows the enabled features for this deploy step.
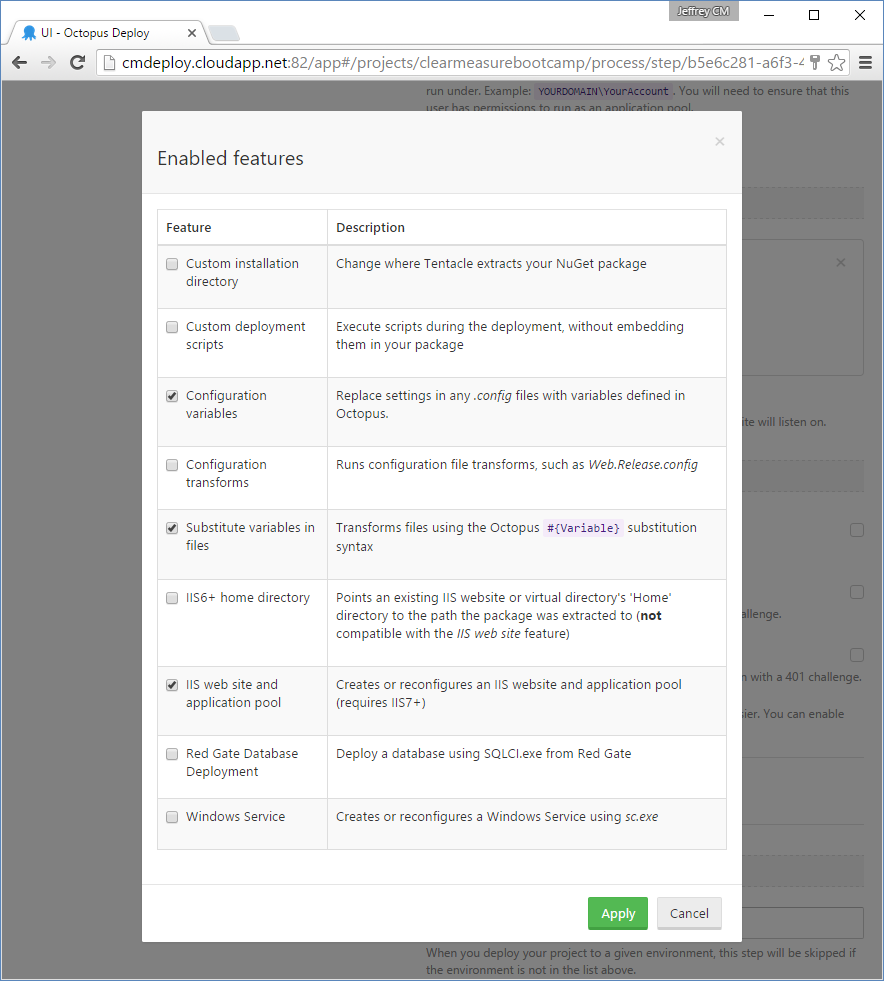
You can see that this step enables a few additional features. The IIS website feature is quite obvious, and it's essential because this deployment step needs to be enabled as a website. But the configuration variables and substitution variables are tremendously useful as well. For example, you have two files that need information embedded in them at deployment time. The first is to help developers, support technicians, and users know what version of the application is current. The following snippet resides at the end of /Views/Shared/_Layout.cshtml.
<div class="container">
    <footer>
        <p>Environment: #{Octopus.Environment.Name}-
           Machine: #{Octopus.Machine.Name} -
           Release: #{Octopus.Release.Number}</p>
        <p>Database: #{DatabaseName}</p>
    </footer>
</div>
These variables are replaced by the actual values at deploy time. On a developer workstation, this exact text is displayed, but on a deployed environment, they yield very useful information, as shown in Figure 16.
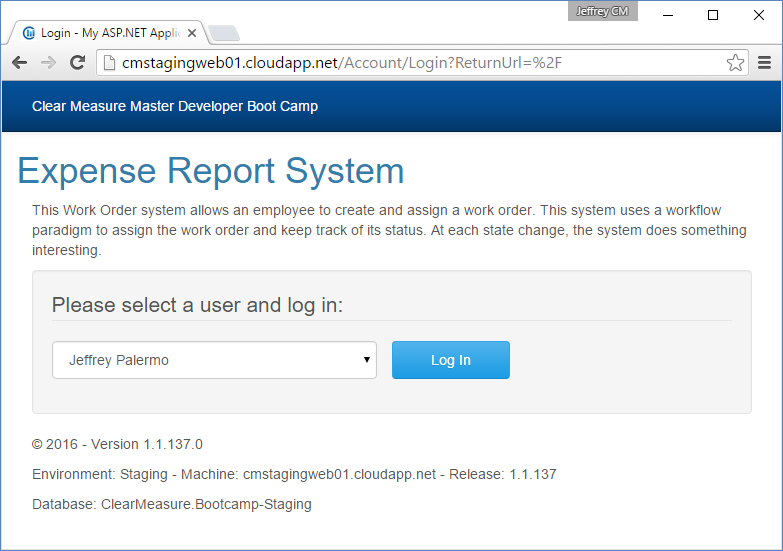
Any file can have variables to be replaced as you find useful. This application has an additional file specifically meant to help you understand how the applications are running across all environments. The following is the first few lines of the newrelic.config file.
<?xml version="1.0"?>
<!-- Copyright (c) 2008-2014 New Relic, Inc. All rights reserved. -->
<!-- For more information see:
     https://newrelic.com/docs/dotnet/dotnet-agent-configuration -->
<configuration xmlns="urn:newrelic-config"
               agentEnabled="true">
    <service licenseKey="..." ssl="true" />
    <application>
        <name>#{Octopus.Environment.Name}-#{Octopus.Release.Number}</name>
    </application>
    <log level="info" />
. . .
I'll cover New Relic later in this article, but the ability to embed environment-specific information in the application at deployment time is essential. The final deployment-time feature that you use is the ability to run arbitrary PowerShell scripts during the deployment process based on the file name. In the UI project, you have a PostDeploy.ps1 file. This file executes on the target server at the conclusion of the deployment to this particular server. It can include any Octopus Deploy variables and perform any action afforded to the service account that the Tentacle process uses. Listing 1 shows the full script that you run on the Web servers once the Web application has been deployed. You can see that you completely restructure the connection string in the NHibernate configuration file.
Listing 1: The PostDeploy.ps1 file runs at the conclusion of the deployment on a target server.
#
# PostDeploy.ps1
#
$path = $PSScriptRoot
$hibernateConfig = "$path\bin\hibernate.cfg.xml"
$integratedSecurity = "Integrated Security=true"
$DatabaseServer = $OctopusParameters["DatabaseServer"]
$DatabaseName = $OctopusParameters["DatabaseName"]
$connection_string = "server=$DatabaseServer;database=$DatabaseName;
    $integratedSecurity;"

$filePath = $hibernateConfig
$xpath = "//e:property[@name = 'connection.connection_string']"
$value = $connection_string
$namespaces = @{"e" = "urn:nhibernate-configuration-2.2"}

[xml] $fileXml = Get-Content $filePath

if($namespaces -ne $null -and $namespaces.Count -gt 0) {
    $ns = New-Object Xml.XmlNamespaceManager
        $fileXml.NameTable
    $namespaces.GetEnumerator() |
        %{ $ns.AddNamespace($_.Key,$_.Value) }
    $node = $fileXml.SelectSingleNode($xpath,$ns)
} else {
    $node = $fileXml.SelectSingleNode($xpath)
}

if($node.NodeType -eq "Element") {
    $node.InnerText = $value
} else {
    $node.Value = $value
}

$fileXml.Save($filePath)
The last step in the deployment process, shown in Figure 17, is particularly interesting because it implements a quick smoke test to ensure that the deploy process was successful at starting up all the application components.
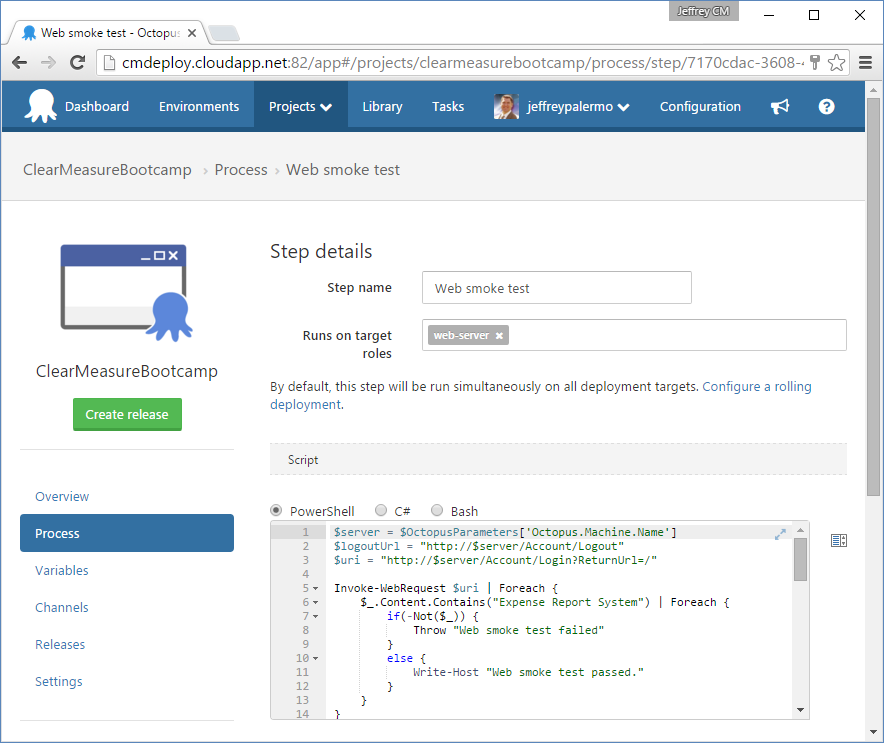
This step is merely a PowerShell script that has full access to the Octopus Deploy variables so that it knows exactly which server it runs on as well as any other information that might be useful. Via PowerShell COM, this script opens up a headless Internet Explorer browser object and uses it to pull up the application and navigate to nearly a dozen pages to ensure that the application is fully online. If it can't perform these steps, the deployment fails and the errors are recorded in the log. Listing 2 shows the full smoke test script.
Listing 2: This smoke-test script uses a headless Internet Explorer browser to run the Web application through its paces
$server = $OctopusParameters['Octopus.Machine.Name']
$logoutUrl = "http://$server/Account/Logout"
$uri = "http://$server/Account/Login?ReturnUrl=/"

Invoke-WebRequest $uri | Foreach {
    $_.Content.Contains("Expense Report System") | Foreach {
        if(-Not($_)) {
            Throw "Web smoke test failed"
        }
        else {
            Write-Host "Web smoke test passed."
        }
    }
}

$ie = New-Object -ComObject "InternetExplorer.Application"
$ie.Navigate($logoutUrl)
while($ie.Busy -eq $true) {
    Start-Sleep -Seconds 1
}

$ie.navigate($uri)
$ie.visible = $false
while($ie.Busy -eq $true) {
    Start-Sleep -Seconds 1
}

$doc = $ie.Document

# commit the button
$commit = $ie.Document.IHTMLDocument3_getElementsByTagName("button")

$commit | Foreach {$_.Click()}
while($ie.Busy -eq $true) {
    Start-Sleep -Seconds 1
}

$ie.Document.IHTMLDocument3_getElementsByTagName("a") | Foreach {
    $href = $_.Attributes["href"].Value

    if($href -ne "http://clear-measure.com/") {
        Write-Host "Calling $href"
        Invoke-WebRequest $href | Write-Verbose
    }
}

$ie.Document.IHTMLDocument3_getElementsByTagName("a") | Foreach {
    if($_.InnerText -eq "Logout"){
        $_.Click();
    }
}

$ie.Quit()
Configuring TeamCity for a Build Chain
Now that you have Octopus Deploy configured to deploy the application properly, you need to configure JetBrains TeamCity to implement the logic and behavior for a fully continuous delivery pipeline. TeamCity contains the logic for when to move on to the next stage and what things to check in order to know if one of the deployments or test suites failed. Every step in the deployment pipeline requires some critical things:
- A purpose or goal
- Automated tests that verify whether you have accomplished the goal
- A clean and perfectly reliable environment in which to run these automated tests without side-effect or anomalies
Figure 18 shows the ClearMeasureBootcamp project settings within TeamCity.
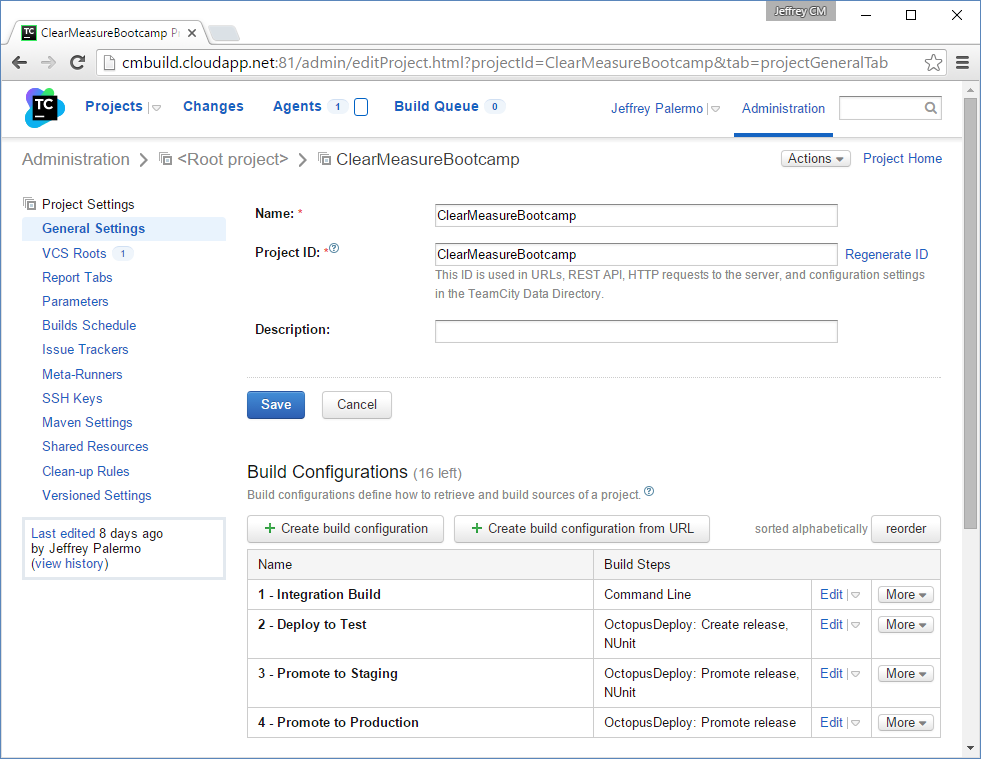
The build server is hosted in Azure on a VM at cmbuild.cloudapp.net. It happens to be in the same place as the Octopus Deploy server, but that isn't a requirement. The only requirement is that the TeamCity server be able to reach the Octopus Deploy host server and port on which it runs. And the Octopus Deploy server must be able to reach the TeamCity NuGet feed URL for pulling down release packages. In the TeamCity project, you have four build configurations.
- Integration Build: runs
ci.bat, which is the full continuous integration process (clean, compile, test, package) - Deploy to Test: creates a release and instructs Octopus Deploy to deploy to the test environment; runs functional tests
- Promote to Staging: promotes the current release to staging; runs acceptance tests
- Promote to Production: promotes the current release to production
Figure 19 shows the environment variables that you've configured in the Integration Build.
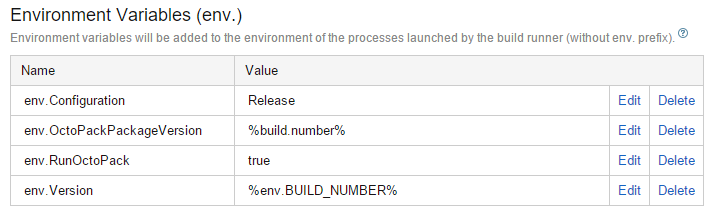
Because PowerShell is a .NET-powered scripting language, you can fully use classes and functions in the .NET Framework.
These variables are available to the build script and any process that's kicked off by this build. Naturally, the version is important, but env.RunOctoPack is important as well. The following snippet is in the properties section of the default.ps1 psake build script.
$version = $env:Version
$projectConfig = $env:Configuration
$runOctoPack = $env:RunOctoPack

if([string]::IsNullOrEmpty($version)) {
    $version = "1.0.0"}
if([string]::IsNullOrEmpty($projectConfig)) {
    $projectConfig = "Release"}
if([string]::IsNullOrEmpty($runOctoPack)) {
    $runOctoPack = "true"}
This is where you initialize some PowerShell variables via the environment variables set in TeamCity. But if you're running the build script locally or on a computer outside of TeamCity, you set them to local values so that the build script continues to function even outside of the TeamCity context. Notice that because PowerShell is a .NET-powered scripting language, you can fully use classes and functions in the .NET Framework to perform logic. Here, you're using the IsNullOrEmpty method of the String class. The $runOctoPack variable is important because it flows through to MSBuild.exe when you compile.
task Compile -depends Init {
    exec {
        & msbuild /t:Clean`;Rebuild /v:n /nologo
            /p:Configuration=$projectConfig
            /p:OctoPackPackageVersion=$version
            /p:RunOctoPack=$runOctoPack
            /p:OctoPackEnforceAddingFiles=true
            $source_dir\$projectName.sln
    }
}
When you installed the OctoPack NuGet package, you integrated a new target into the .csproj files that watches for the RunOctoPack property to know whether to generate a release NuGet package from the project or not at the end of the compile step. Listing 3 shows the full psake build script.
Listing 3: THe psake-powered build script is enhanced with Octopus Deploy capabilities to build release packages
Framework "4.6"

properties {
    $projectName = "ClearMeasure.Bootcamp"
    $unitTestAssembly = "ClearMeasure.Bootcamp.UnitTests.dll"
    $integrationTestAssembly ="ClearMeasure.Bootcamp.IntegrationTests.dll"
    $projectConfig = $env:Configuration
    $version = $env:Version
    $base_dir = resolve-path .\
    $source_dir = "$base_dir\src"
    $nunitPath = "$source_dir\packages\NUnit*\Tools"

    $build_dir = "$base_dir\build"
    $test_dir = "$build_dir\test"
    $testCopyIgnorePath = "_ReSharper"
    $package_dir = "$build_dir\package"
    $runOctoPack = $env:RunOctoPack

    $databaseName = $projectName
    $databaseServer = "localhost\SQLEXPRESS2014"
    $databaseScripts = "$source_dir\Database\scripts"
    $hibernateConfig = "$source_dir\hibernate.cfg.xml"
    $schemaDatabaseName = $databaseName + "_schema"
    $integratedSecurity = "Integrated Security=true"
    $connection_string = "server=$databaseserver;
        database=$databasename;$databaseUser;"
    $AliaSql = "$source_dir\Database\scripts\AliaSql.exe"
    $webapp_dir = "$source_dir\UI"

    if([string]::IsNullOrEmpty($version)) { $version = "1.0.0"}
    if([string]::IsNullOrEmpty($projectConfig)) {
        $projectConfig = "Release"}
    if([string]::IsNullOrEmpty($runOctoPack)) {
        $runOctoPack = "true"}
}

task default -depends Init, Compile, RebuildDatabase, Test, LoadData
task ci -depends Init, CommonAssemblyInfo, ConnectionString,
    Compile, RebuildDatabase, Test #, Package

task Init {
    delete_file $package_file
    delete_directory $build_dir
    create_directory $test_dir
    create_directory $build_dir

    Write-Host $projectConfig
    Write-Host $version
    Write-Host $runOctoPack

}

task ConnectionString {
    $connection_string = "server=$databaseserver;
        database=$databasename;$integratedSecurity;"
    write-host "Using connection string: $connection_string"
    if ( Test-Path "$hibernateConfig" ) {
        poke-xml $hibernateConfig "//e:property[@name =
            'connection.connection_string']" $connection_string @{"e" =
            "urn:nhibernate-configuration-2.2"}
    }
}

task Compile -depends Init {
    exec {
        & msbuild /t:Clean`;Rebuild /v:n /nologo
            /p:Configuration=$projectConfig
            /p:OctoPackPackageVersion=$version
            /p:RunOctoPack=$runOctoPack
            /p:OctoPackEnforceAddingFiles=true
            $source_dir\$projectName.sln
    }
}

task Test {
    copy_all_assemblies_for_test $test_dir
    exec {
        & $nunitPath\nunit-console.exe $test_dir\$unitTestAssembly
            $test_dir\$integrationTestAssembly /nologo
            /xml=$build_dir\TestResult.xml
    }
}

task RebuildDatabase -depends ConnectionString {
    exec {
        & $AliaSql Rebuild $databaseServer $databaseName
        $databaseScripts
    }
}

task RebuildRemoteDatabase {
    write-host "Using database username: $databaseUsername"
    exec {
        & $AliaSql Rebuild $databaseServer $databaseName
        $databaseScripts $databaseUsername $databasePassword
    }
}

task LoadData -depends ConnectionString, Compile, RebuildDatabase {
    exec {
        & $nunitPath\nunit-console.exe
            $test_dir\$integrationTestAssembly /include=DataLoader
            /nologo /nodots /xml=$build_dir\DataLoadResult.xml
    } "Build failed - data load failure"
}

task CommonAssemblyInfo {
    create-commonAssemblyInfo "$version" $projectName "$source_dir\CommonAssemblyInfo.cs"
}
When you come back to TeamCity to put together the full deploy pipeline, you'll use the build chains feature. Figure 20 shows the finished product of the build chain in TeamCity with the four build configurations fully aware of each other and connected.
To connect the builds together, you use a combination of triggers and dependencies. Triggers are self-explanatory, and you have each successive step in the deployment pipeline kick off after success of the previous step. Figure 21 shows the dependencies configured for the Promote to Production build configuration.
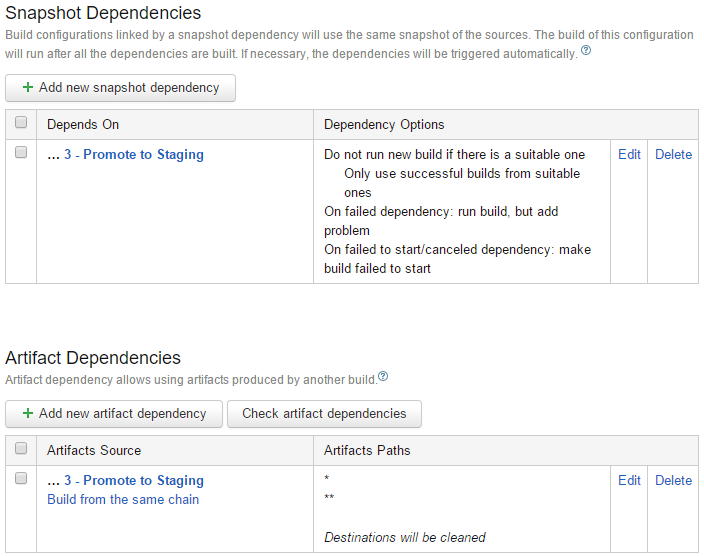
You use both Snapshot Dependencies and Artifact Dependencies to ensure that the deployment to production uses the exact source and release packages as the previous steps. The snapshot dependency ensures that this build runs using the same environment as the build it depends on. The artifacts dependency causes this build to use the artifacts published from the previous build as its source. Therefore, the Promote to Production build receives the Octopus Deploy NuGet release packages that were deployed to staging. It uses these to do its work. For this chaining to work, it's important that all previous steps publish the NuGet release packages as artifacts as well.
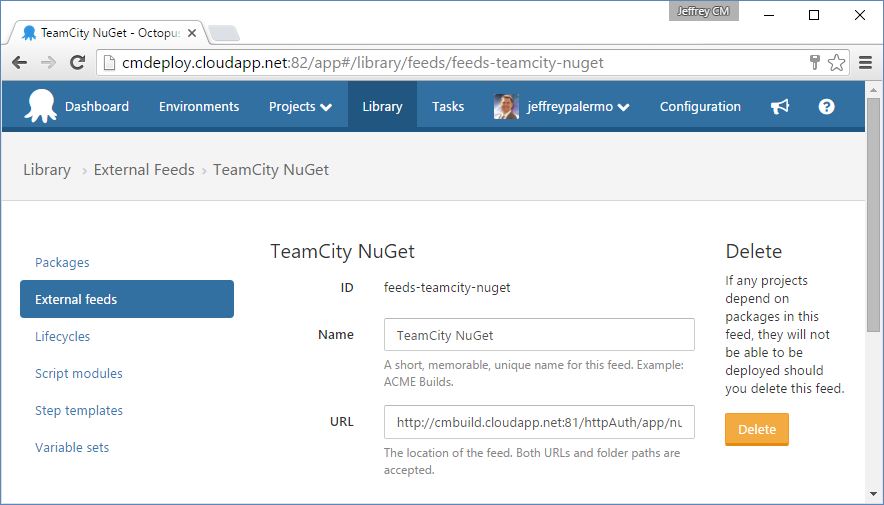
A final piece of integration between Octopus Deploy and TeamCity is to connect the NuGet feed that TeamCity uses to publish artifacts to the deployment configuration. Figure 22 shows the External feeds configuration screen within Octopus Deploy.
Now that you have everything wired together, you can add the steps in the TeamCity deployment pipeline that do the publishing. Figure 23 shows the main build step in the Deploy to Test build configuration.
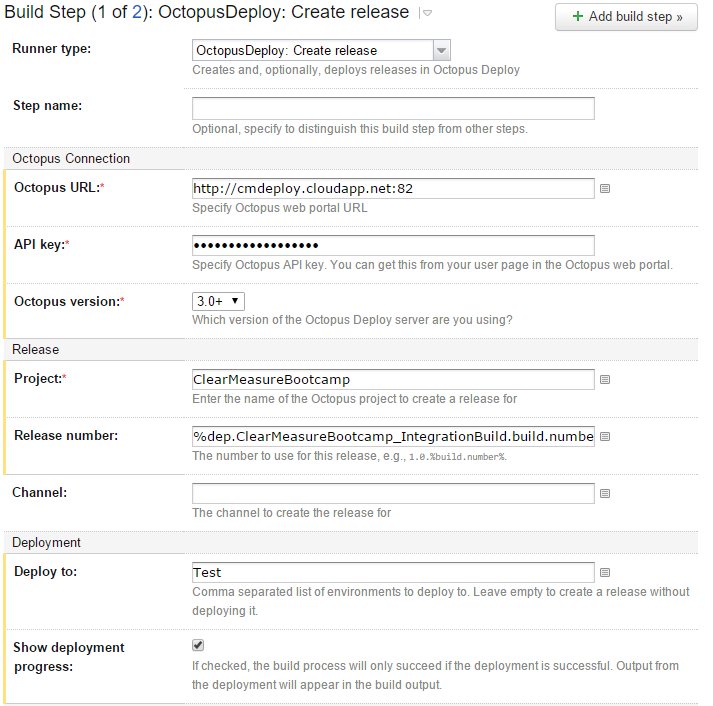
Notice that you have added the Octopus Deploy server URL and a secret API key, as well as the project name and environment to which to deploy. In addition, you have ensured that the release number remains the same as the original number that you applied in the Integration Build.
Putting It All Together
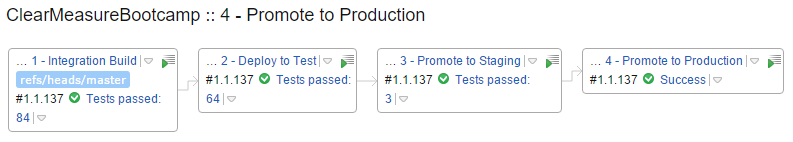
Now that you have all the pieces connected, you can run the Integration Build and see the result of the full process. Figure 24 shows the build chain fully completed.
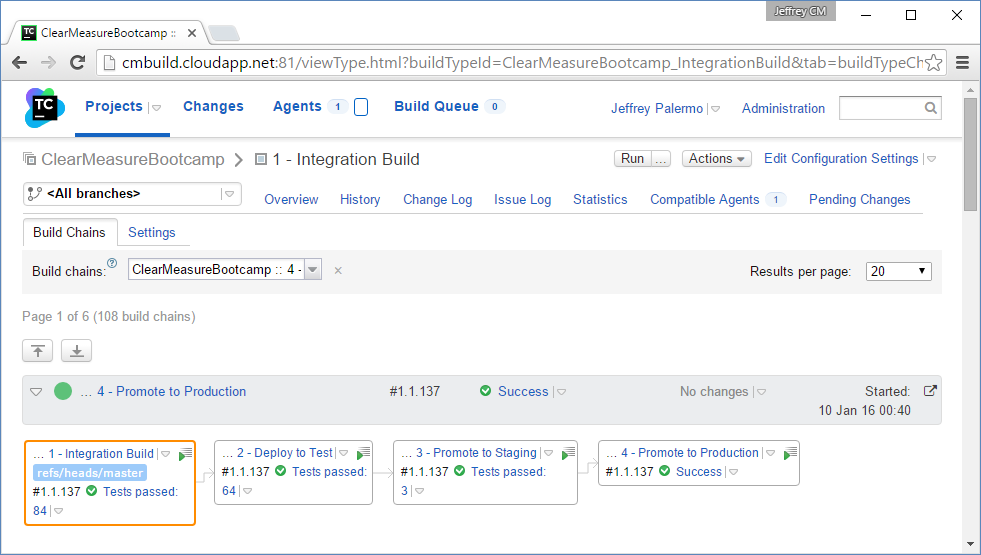
You can see that there were 84 tests run in the Integration Build, 64 functional tests run against the test environment, three acceptance tests run against the staging environment, and nothing but a success message for the promotion to production. In reality, the Promote to Production build does nothing but file a Promote request with Octopus Deploy. Figure 25 shows the state of the deployments for release 1.1.137.
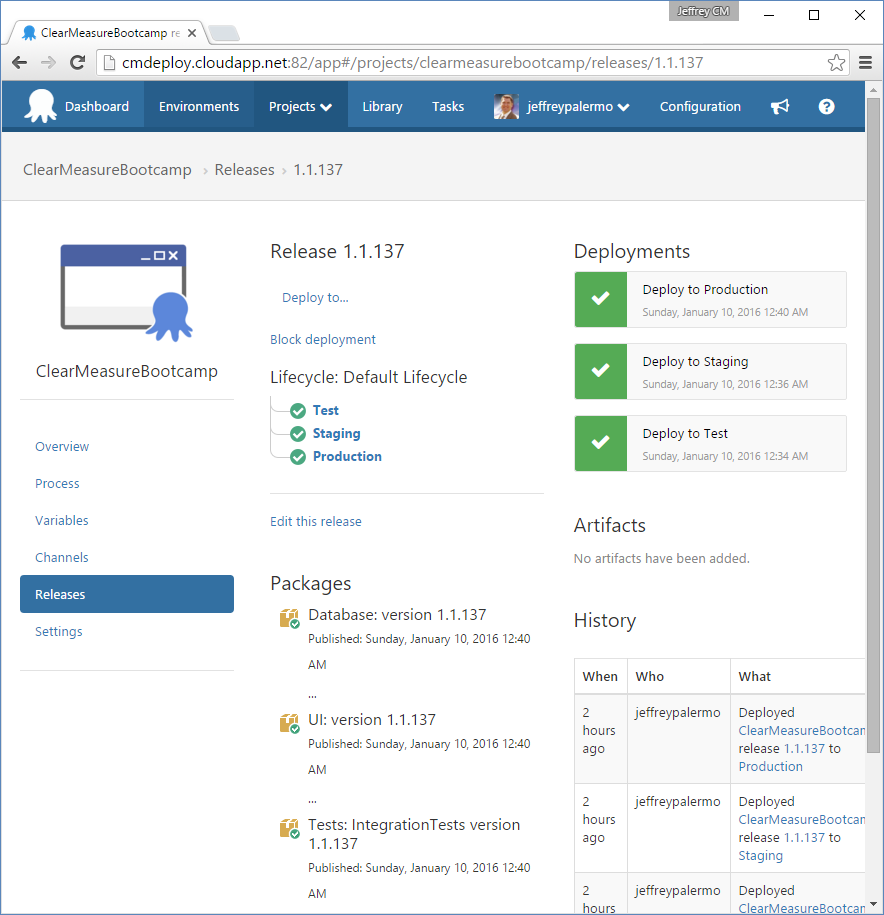
You can see that the test and staging deployments are complete and green, but the production deployment is waiting. This is because of the manual approval step you inserted into the process. If you click on the yellow icon, you're presented with the opportunity to add a note and then click a Proceed button, as shown in Figure 26.
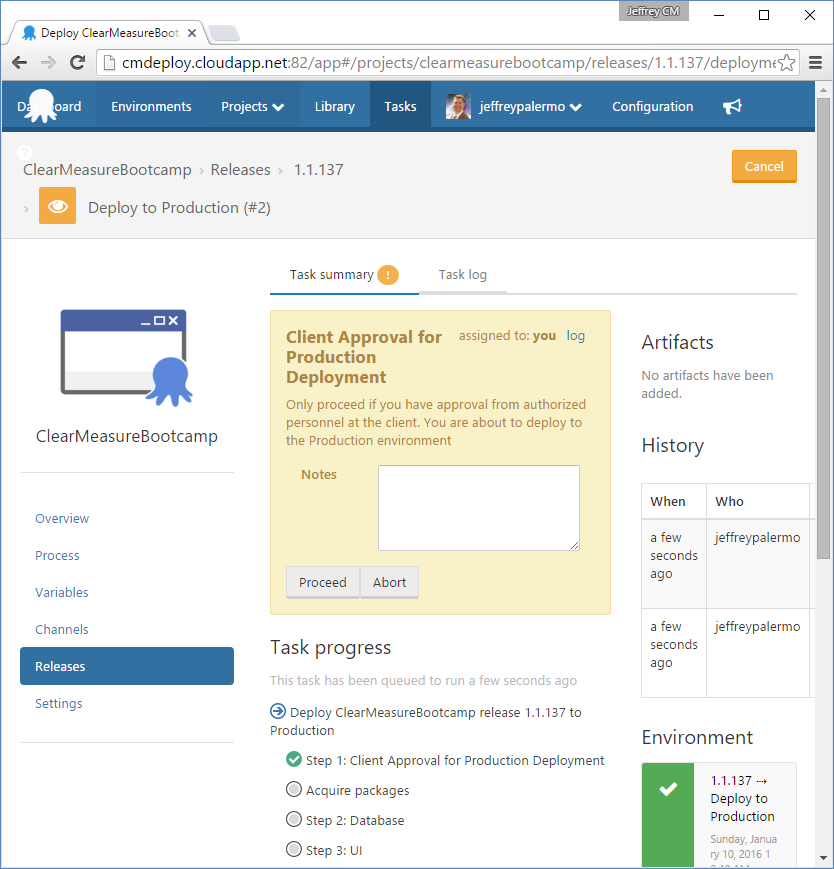
The production deployment won't proceed without this manual approval. If you omitted this manual approval, you'd be implementing continuous deployment because code would make its way to production only by the automation succeeding at each step in the deployment pipeline. Figure 27 represents the production deployment in progress, and you can closely monitor it via the online logs if you so choose.
It's as easy as a few clicks to create a manual approval step in the deployment pipeline. This could be used for UAT, compliance approvals, or any other purpose where the organization requires a human judgement to determine whether or not to proceed.
Integrating the Dev with the Ops
You've seen how easy it is to set up a continuous delivery pipeline using JetBrains TeamCity, and Octopus Deploy. This works great for getting code out to production. But what about when the code is already there? How can you monitor it and flow back learning into the pipeline? And if you believe that staging should be an exact clone of production, how can you employ the same monitoring on staging as you do in production?
In this application, you've configured the New Relic product to watch the application across all of the environments. Figure 28 shows the dashboard where you're watching every version of every release.
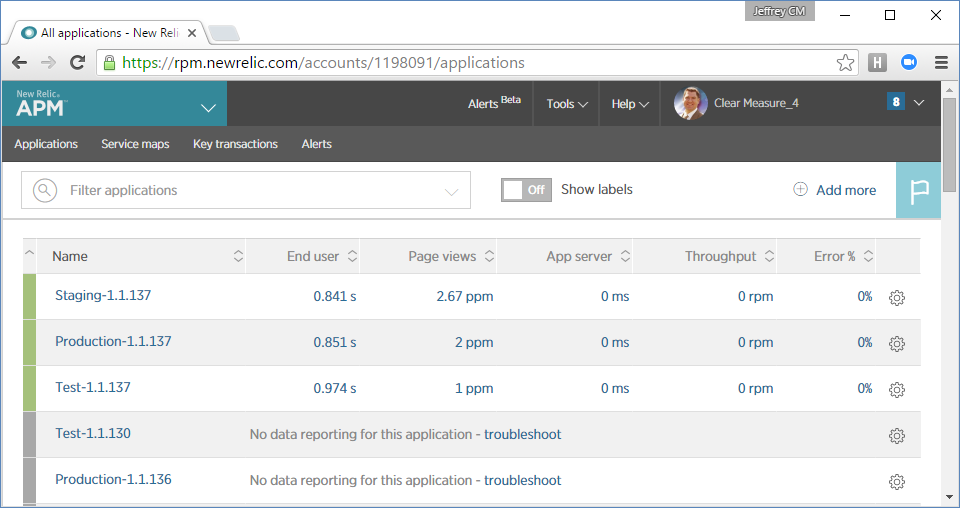
In a DevOps and cloud world, it's important for there to be no daylight between development and operations. Earlier, you saw how I integrated a newrelic.config file into the source code so that you could properly connect this production monitoring tool. It's important to completely connect production support tools and infrastructure with pre-production environments. Without that integration, production monitoring represents one piece of the system that was never tested. And experienced developers know that if something isn't tested, it's likely to be already broken.
How the Cloud Helps Scale Continuous Delivery
Azure capabilities, as well as other cloud platform capabilities, help you move fast. Speed is the name of game when it comes to DevOps. The following are features that almost all cloud platforms provide that not only make continuous delivery possible, but make it easy.
- Fast provisioning of servers and infrastructure
- Configuration modification via code and scripts
- Easy environment expansion
- Environment parallelization
- Cost savings over fully owned hardware for every environment
- The ability to turn off environments that are used less frequently
- Cloning of environments
Cloud technologies reduce what was once a very difficult physical resource to manage into simple and flexible resources that are created and managed by versionable lines of source code. Although the Infrastructure as Code concept is used by sophisticated teams, cloud technologies are bringing scriptable infrastructure to the mass market. Continuous delivery can be used in non-cloud environments, but it can also be implemented quickly and inexpensively in the cloud.
Conclusion
In this article, I've provided an overview of the DevOps movement and demonstrated how to set up a continuous delivery environment using a world-class combination of tools and commercial products. I've discussed how to ensure that operations and development are integrated, and you've learned how cloud technologies aid in the speed required for a DevOps workflow. All of the code used in this article is available via the GitHub repository mentioned herein. I hope this aids you in our continuous delivery journey.