


The theme for .NET 5 is a unified runtime and framework that can be used everywhere with uniform runtime behaviors and developer experiences. Microsoft released tools to work with big data (.NET for Spark) and machine learning (ML.NET) in .NET that work together to provide a productive end-to-end experience. In this article, we'll cover the basics of .NET for Spark, big data, ML.NET, and machine learning, and we'll dig into the APIs and capabilities to show you how straightforward it is to get started building and consuming your own Spark jobs and ML.NET models.
What's Big Data?
Big data is an industry term that is practically self-explanatory. The term refers to large data sets, typically involving terabytes or even petabytes of information, that are used as input for analysis to reveal patterns and trends in the data. The key differentiator between big data and traditional workloads is that big data tends to be too large, complex, or variable for traditional databases and applications to handle. A popular way to classify data is referred to as the “Three Vs.”
Big data solutions are tailored to fit high-volumes, handle a wide variety of data structures, and manage velocity through batching (processing large volumes of data at rest) and streaming (processing data in motion).
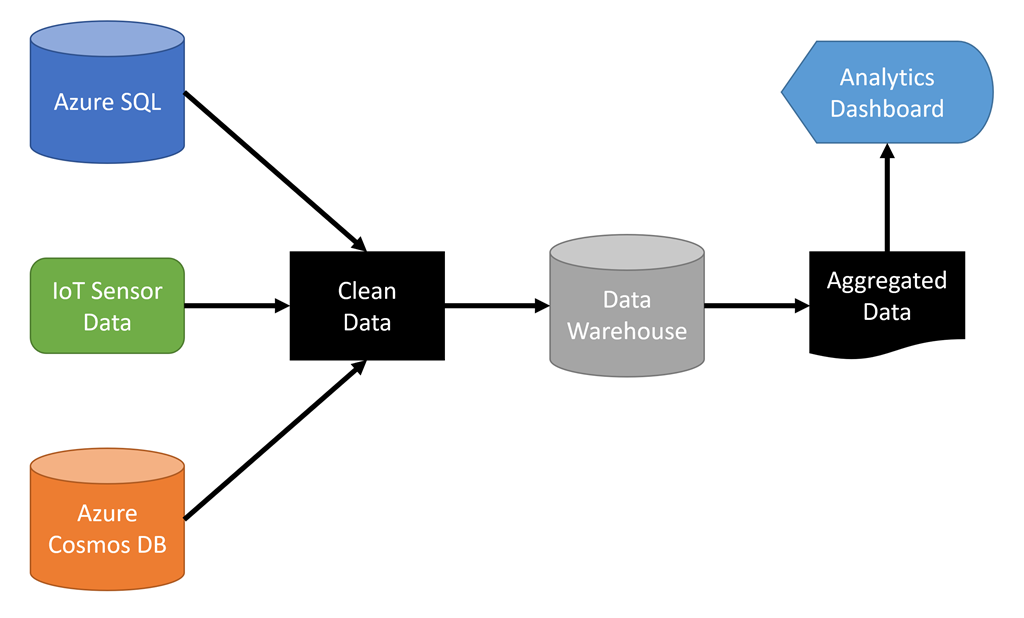
Most big data solutions provide the means to store data in a data warehouse that's typically a distributed cluster optimized for rapid retrieval and parallel processing. Dealing with big data often involves multiple steps, as demonstrated in Figure 1.
.NET 5 developers who need to create analytics and insights based on large data sets can take advantage of a popular big data solution named Apache Spark? by using .NET for Spark.
What's .NET for Spark?
.NET for Spark is based on Apache Spark, an open-source analytics engine for processing big data. It's designed to process large amounts of data in memory to provide better performance than other solutions that rely on persistent storage. It's a distributed system and processes workloads in parallel. It provides support for loading data, querying data (as part of a process and interactively), processing data, and outputting data.
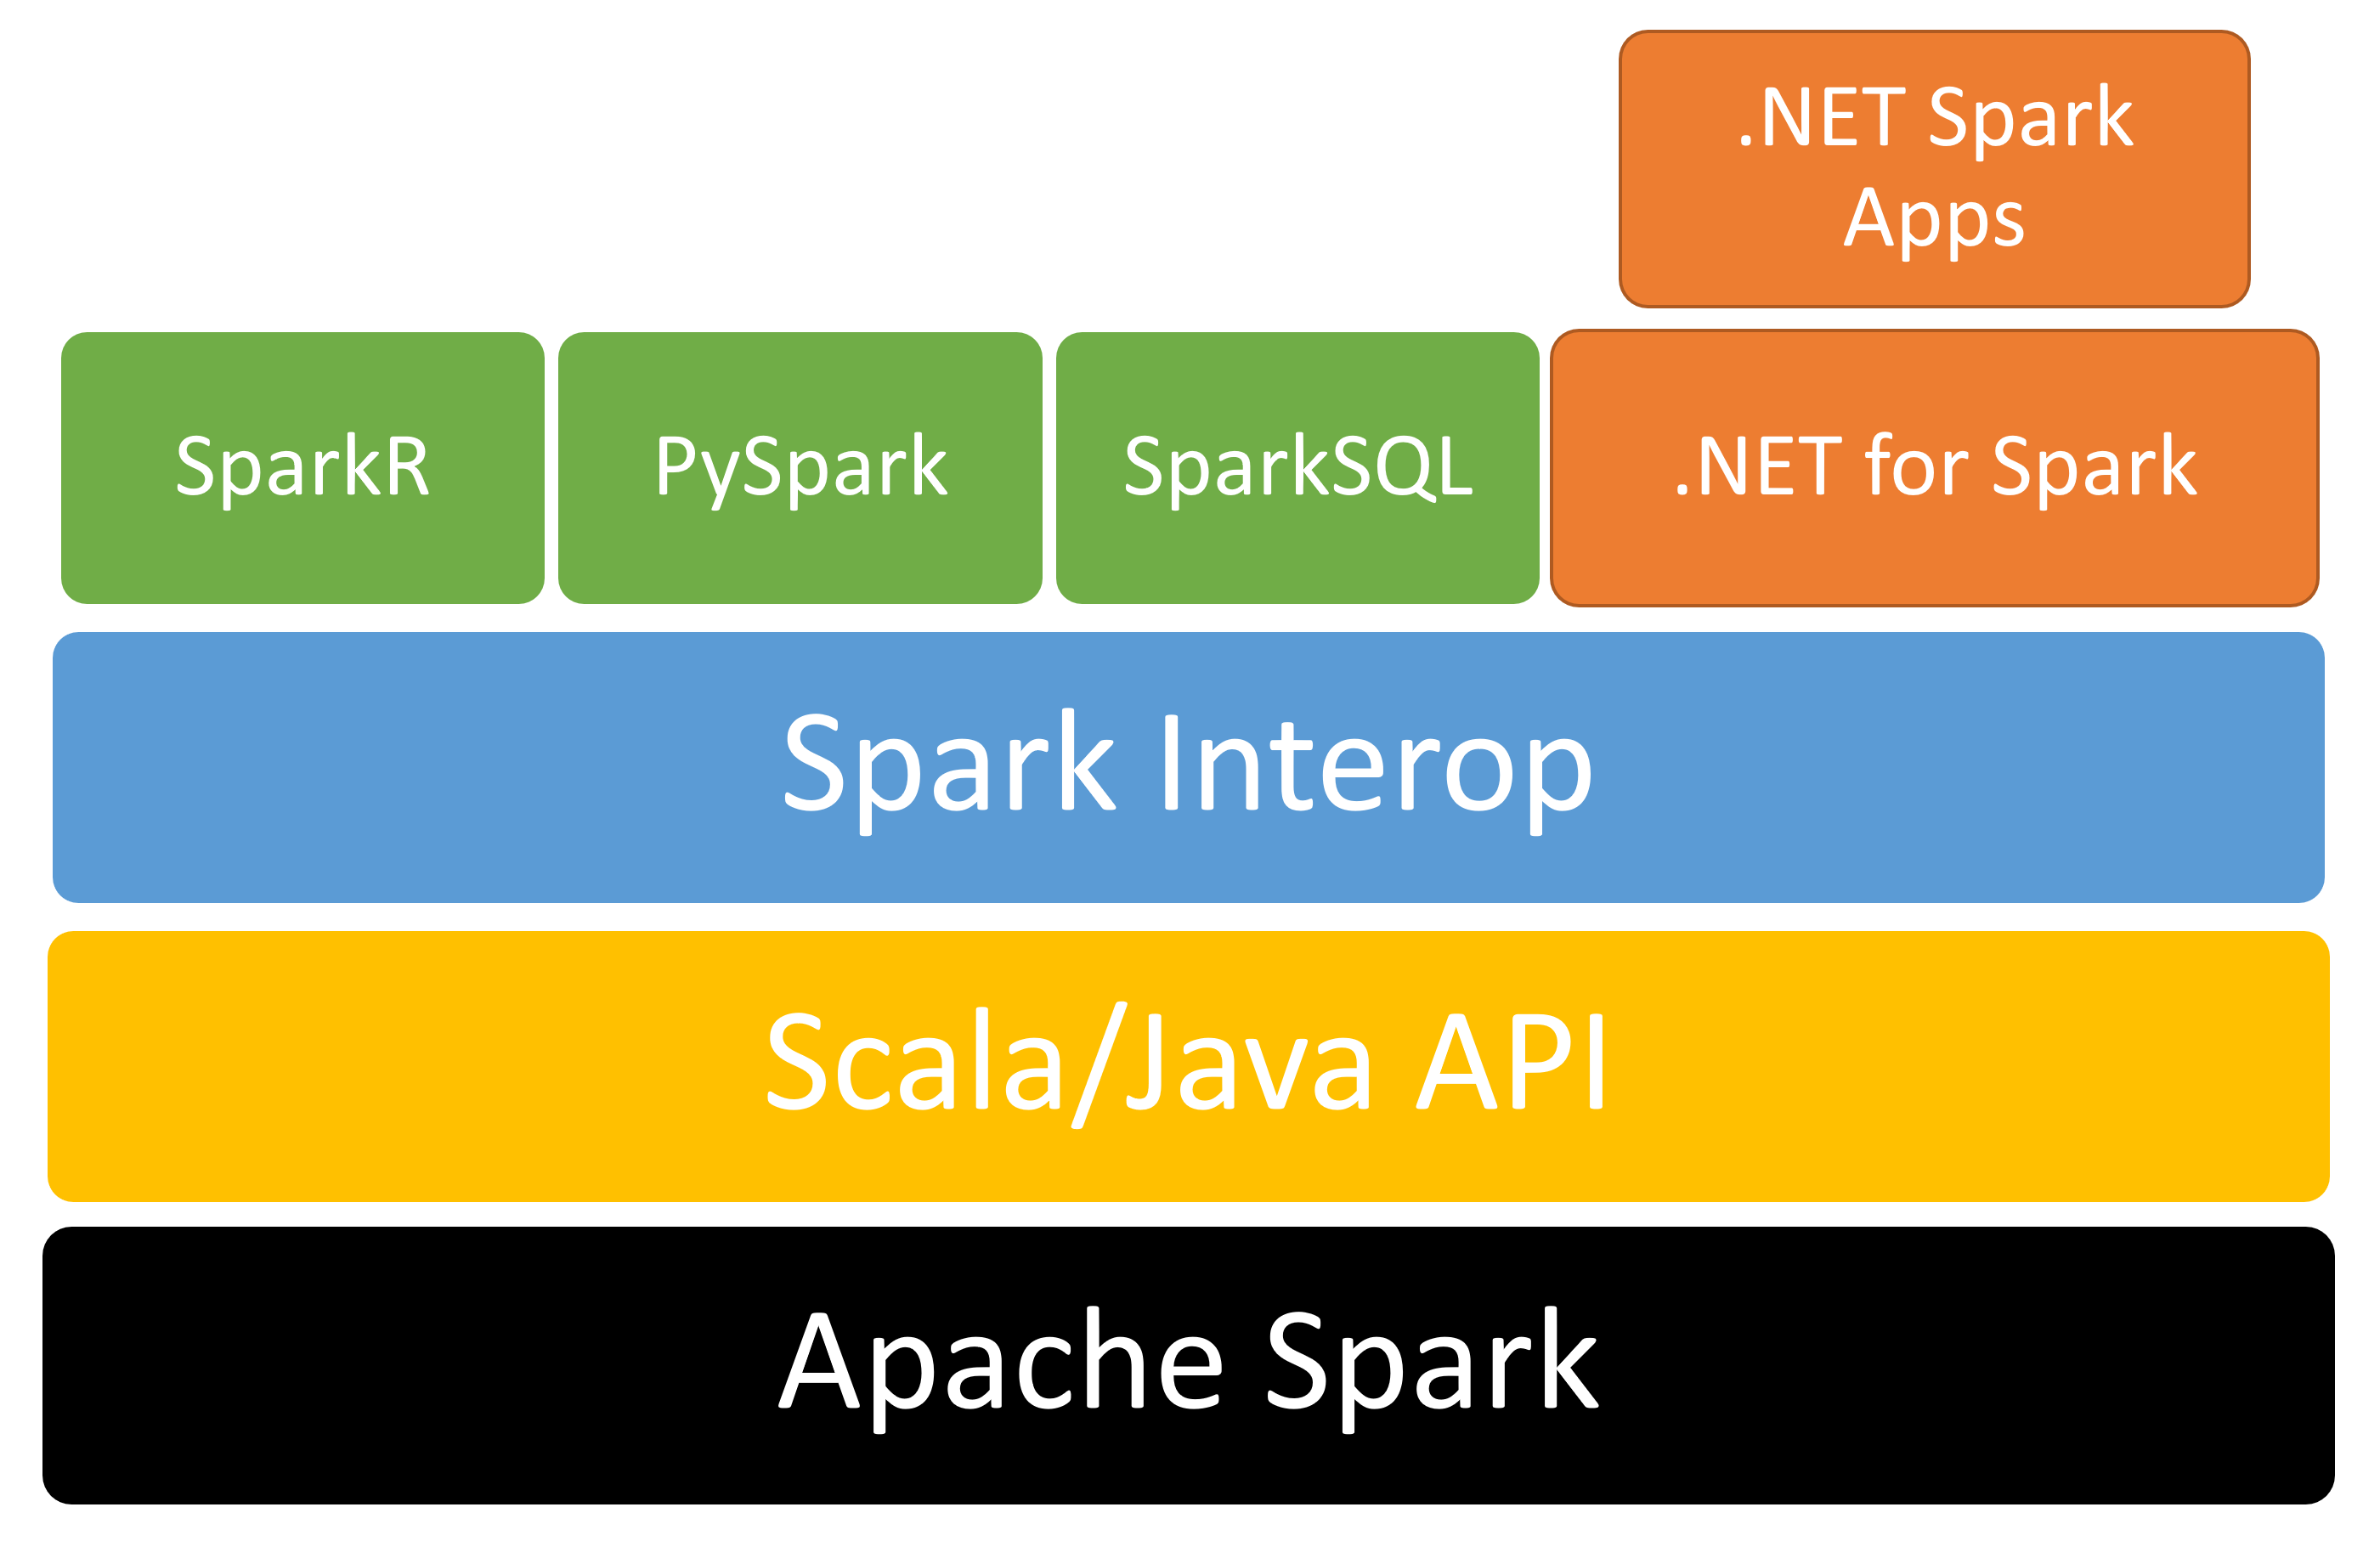
Apache Spark supports Java, Scala, Python, R, and SQL out of the box. Microsoft created .NET for Spark to add support for .NET. The solution provides free, open-course, cross-platform tools for building big data applications using .NET-supported languages like C# and F# so that you can use existing .NET libraries while taking advantage of Spark features such as SparkSQL. Figure 2 illustrates the high-level solution stack.
Listing 1 displays a small but complete .NET for Spark application that reads a text file and outputs the word count in descending order.
Listing 1: Use .NET for Spark to generate a word count
using Microsoft.Spark.Sql;

namespace MySparkApp
{
    class Program
    {
        static void Main(string[] args)
        {
            // Create a Spark session.
            SparkSession spark = SparkSession.Builder().AppName("word_count_sample").GetOrCreate();

            // Create initial DataFrame.
            DataFrame dataFrame = spark.Read().Text("input.txt");

            // Count words.
            DataFrame words = dataFrame.Select(Functions.Split(Functions.Col("value"), " ").Alias("words"))
                .Select(Functions.Explode(Functions .Col("words"))
                .Alias("word"))
                .GroupBy("word")
                .Count()
                .OrderBy(Functions.Col("count").Desc());

            // Show results.
            words.Show();

            // Stop Spark session.
            spark.Stop();
        }
    }
}
Setting up .NET for Apache Spark on a development computer involves installation of several dependencies, including the Java SDK and Apache Spark. You can access detailed step-by-step directions in the Getting Started guide at https://aka.ms/go-spark-net.
Spark for .NET is designed to run in multiple environments and can be deployed to run in the cloud. Possible deployment targets include Azure HDInsight, Azure Synapse, AWS EMR Spark, and Databricks. Cloud-based jobs connect to storage accounts for data. If the data is available as part of your project, you can submit it along with your other project files.
Big data is often used in conjunction with machine learning to gain insights about the data.
What's Machine Learning?
First, let's go over the basics of artificial intelligence and machine learning.
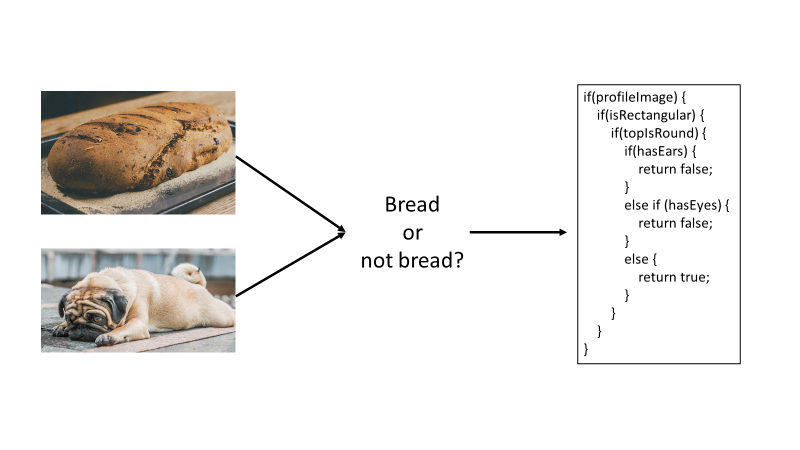
Artificial intelligence (AI) is the ability of a computer to imitate human intelligence and abilities, such as reasoning and finding meaning. Typical AI techniques often start as rule- or logic-based systems. As a simple example, think about the scenario where you want to classify something as “bread” or “not bread.” When you start, it may seem like an easy problem, such as “if it has eyes, it's not bread.” However, you will quickly start to realize that there are a lot of different features that can characterize something as bread vs. not bread, and the more features you have, the longer and more complex the series of if statements will get, as demonstrated in Figure 3.
As you can see from the example in Figure 3, traditional, rules-based AI techniques are often difficult to scale. This is where machine learning comes in. Machine learning (ML) is a subset of artificial intelligence that finds patterns in past data and learns from experience to act on new data. ML allows computers to make predictions without being explicitly programmed with logic rules. Thus, you can use ML when you have a problem that's difficult (or impossible) to solve with rules-based programming. You can think of ML as “programming the unprogrammable.”
To solve the “bread” vs. “not bread” problem with ML, you provide examples of bread and examples of not bread (as seen in Figure 4) instead of implementing a long, complicated series of if statements. You pass these examples to an algorithm, which finds patterns in the data and returns a model that you can then use to predict whether images, which have not yet been seen by the model, are “bread” or “not bread.”
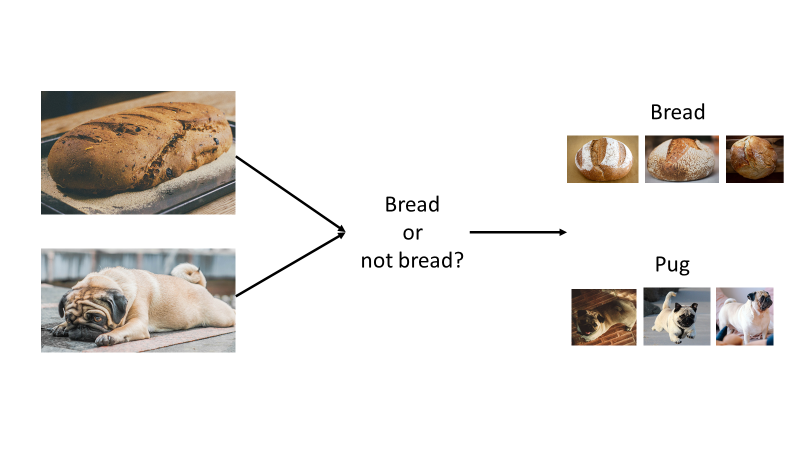
Figure 5 demonstrates another way to think about AI vs. ML. AI takes in rules and data as input with an expected output of the answers based on those rules. ML, on the other hand, takes in data and answers as the input and outputs the rules that can be used to generalize on new data.

AI takes in rules and data as input with an expected output of the answers based on those rules. ML takes in data and answers as the input and outputs the rules that can be used to generalize on new data.
What's ML.NET?
Microsoft released ML.NET, an open-source, cross-platform ML framework for .NET developers, at Build in May 2019. Teams at Microsoft have widely used internal versions of the framework for popular ML-powered features for the last nine years; some examples include Dynamics 365 Fraud Detection, PowerPoint Design Ideas, and Microsoft Defender Antivirus Threat Protection.
ML.NET allows you to stay in the .NET ecosystem to build, train, and consume ML models without requiring a background in ML or data science. ML.NET runs anywhere that .NET runs: Windows, Linux, macOS, on-prem, offline scenarios like WinForms or WPF desktop apps, or in any cloud, such as Azure. You can use ML.NET for a variety of scenarios, as described in Table 1.
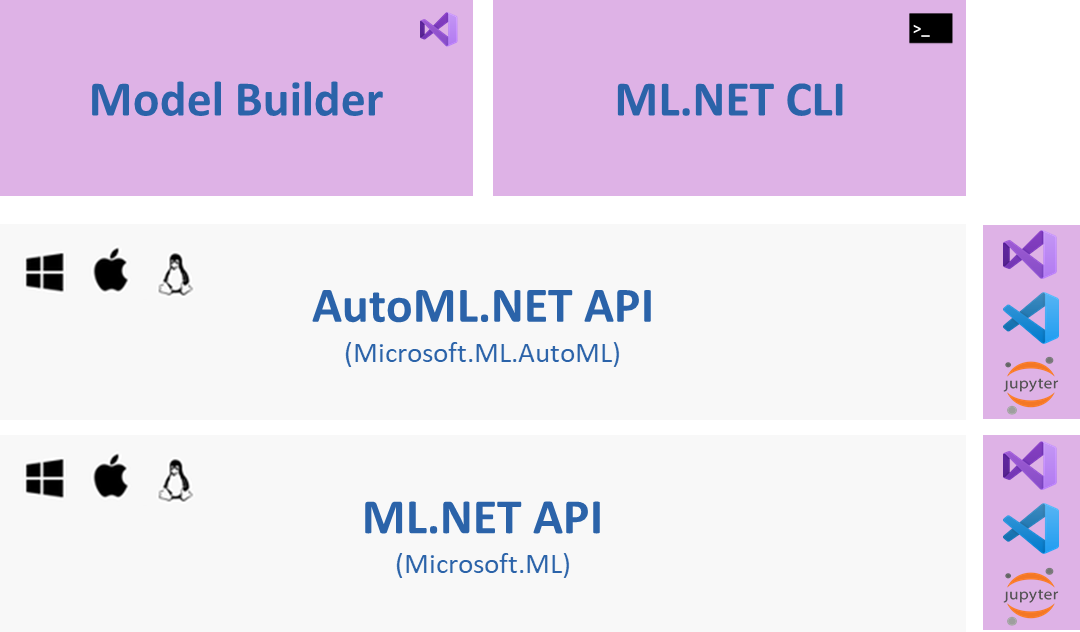
ML.NET uses automated machine learning, or AutoML, to automate the process of building and training an ML model to find the best model based on the scenario and data provided. You can use ML.NET's AutoML via the AutoML.NET API or ML.NET tooling, which includes Model Builder in Visual Studio and the cross-platform ML.NET CLI, as seen in Figure 6. In addition to training the best model, ML.NET tooling also generates the files and C# code necessary for model consumption in the end-user .NET application, which can be any .NET app (desktop, Web, console, etc.). All AutoML scenarios offer a local training option, and image classification also allows you to take advantage of the cloud and train using Azure ML from Model Builder.
You can learn more about ML.NET in Microsoft Docs at https://aka.ms/mlnetdocs.
Combining ML and Big Data with ML.NET and Spark for .NET
Big data and ML go well together. Let's build a pipeline that uses both Spark for .NET and ML.NET to showcase how big data and ML work together. Markdown is a popular language for writing documentation and creating static websites that uses a less complicated syntax than HTML but provides more control over formatting than plain text. This is an excerpt from an example markdown file from the publicly available .NET documentation repo:
---
title: Welcome to .NET
description: Getting started with the .NET
family of technologies.
ms.date: 12/03/2019
ms.custom: "updateeachrelease"
---
# Welcome to .NET

See [Get started with .NET Core](core/get-started.md) to learn how to create .NET Core apps.

Build many types of apps with .NET, such as cloud ,IoT, and games using free cross-platform tools...
The section between the dashes is called front matter and provides metadata about the document using YAML. The section starting with a hash (#) is a top-level heading. Two hashes (##) indicate a sub-heading. The “Get started with .NET Core” is a link, followed by text.
The goal is to process a large collection of documents, add metadata such as word count and estimated reading time, and automatically group similar articles together.
Here is the pipeline you'll build:
- Build a word count for each document.
- Estimate reading time for each document.
- Create a list of top 20 words for each document based on “TF-IDF” or “term frequency/inverse document frequency” (this will be explained later).
The first step is to pull down a document repository and the reference application. You can use any repository or folder structure that contains markdown files. The examples used for this article are from the .NET documentation repository that is available to clone at https://aka.ms/dot-net-docs.
After you prepare your local environment for .NET and Spark, you can pull down the project from https://aka.ms/spark-ml-example.
The solution folder contains a batch command (provided in the repo) that you can use to run all the steps.
Process the Markdown
The DocRepoParser project recursively iterates through subfolders in a repository to gather metadata about various documents. The Common project contains several helper classes. For example, FilesHelper is used for all file I/O. It keeps track of the location to store files and filenames and provides services such as reading files to other projects. The constructor expects a tag (a number that uniquely identifies a workflow) and the path to the repo or top-level folder that contains the documentation. By default, it creates a folder under the user's local application data folder. This can be overridden if necessary.
MarkdownParser leverages a library called Microsoft.Toolkit.Parsers to parse the markdown. The library has two tasks: first, it must extract titles and subtitles, and second, it must extract words. The markdown file is exposed as “blocks” representing headers, links, and other markdown features. Blocks, in turn, contain “inlines” that host the text. For example, this code parses a TableBlock by iterating over rows and cells to find inlines:
case TableBlock table:
    table.Rows.SelectMany(r => r.Cells)
        .SelectMany(c => c.Inlines)
        .ForEach(i => candidate = RecurseInline(i, candidate, words, titles));
        break;
This code extracts the text part of an inline hyperlink:
case HyperlinkInline hyper:
    if (!string.IsNullOrWhiteSpace(hyper.Text))
    {
        words.Append(hyper.Text.ExtractWords());
    }
    break;
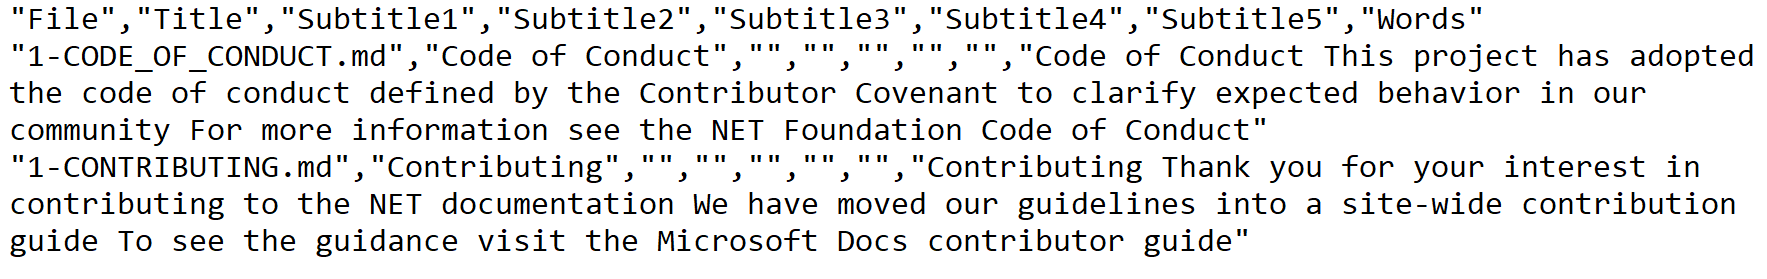
The result is a comma-delimited (CSV) file that looks like Figure 7.
The first step simply prepares the data for processing. The next step uses a Spark for .NET job to determine word count, reading time, and the top 20 terms for each document.
Build the .NET for Spark Job
The SparkWordsProcessor project hosts the .NET for the Spark job to run. Although the app is a console project, it requires Spark to run. The runjob.cmd batch command submits the job to run on a properly configured Windows computer. The pattern for a typical job is to create a session or “app,” perform some logic, then stop the session.
var spark = SparkSession.Builder()
    .AppName(nameof(SparkWordsProcessor))
    .GetOrCreate();
RunJob();
spark.Stop();
The file from the previous step is easily read by passing its path to the Spark session:
var docs = spark.Read().HasHeader().Csv(filesHelper.TempDataFile);
docs.CreateOrReplaceTempView(nameof(docs));
var totalDocs = docs.Count();
The docs variable resolves to a DataFrame. A data frame is essentially a table with a set of columns and a common interface to interact with data regardless of the underlying source. It's possible to reference a data frame from other data frames. SparkSQL can also be used to query data frames. You must create a temporary view that provides an alias to the data frame to reference it from SQL. The CreateOrReplaceTempView method makes it possible to select rows from the data frame like this:
SELECT * FROM docs
The totalDocs variable retrieves a count of all rows in the document. Spark provides a function called Split to break a string into an array. The Explode function turns each array item into a row:
var words = docs.Select(fileCol,
    Functions.Split(nameof(FileDataParse.Words)
    .AsColumn(), " ")
    .Alias(wordList))
    .Select(fileCol, Functions.Explode(wordList.AsColumn())
    .Alias(word));
The query generates one row per word or term. This data frame is the basis for generating the term frequency (TF), or the count of each word per document:
var termFrequency = words.GroupBy(fileCol, Functions.Lower(word.AsColumn()).Alias(word)).Count().OrderBy(fileCol, count.AsColumn().Desc());
Spark has built-in models that can determine “term frequency/inverse document frequency.” For this example, you'll determine term frequency manually to demonstrate how it is calculated. Terms occur with a specific frequency in each document. A document about wizards might have a high count of the term “wizards.” The same document probably has a high count of the words “the” and “is” as well. To us, it's obvious that the term “wizard” is more important and provides more context. Spark, on the other hand, must be trained to recognize important terms. To determine what's truly important, we'll summarize the document frequency*,* or the count of how many times a word appears across all the documents in the repo. This is a “group by distinct occurrences”:
var documentFrequency = words
    .GroupBy(Functions.Lower(word.AsColumn())
    .Alias(word))
    .Agg(Functions.CountDistinct(fileCol)
    .Alias(docFrequency));
Now it's time for math. A special equation computes what's known as the inverse document frequency*,* or IDF. The natural logarithm of total documents (plus one) is input into the equation and divided by the document frequency (plus one) for the word:
static double CalculateIdf(int docFrequency, int totalDocuments) =>
    Math.Log(totalDocuments + 1) / (docFrequency + 1);
Words that appear across all documents are assigned a lower value than words that appear less frequently. For example, given 1000 documents, a term that appears in every document has an IDF of 0.003 compared to a term that only appears in a few documents (~1). Spark supports user-defined functions which you can register like this:
spark.Udf().Register<int, int, double>(nameof(CalculateIdf), CalculateIdf);
Next, you can use the function to compute the IDF of all words in the data frame:
var idfPrep = documentFrequency.Select(word.AsColumn(),
    docFrequency.AsColumn())
        .WithColumn(total, Functions.Lit(totalDocs))
        .WithColumn(inverseDocFrequency,
            Functions.CallUDF(nameof(CalculateIdf), docFrequency.AsColumn(), total.AsColumn()
        )
    );
Using the document frequency data frame, two columns are added. The first is the literal total number of documents, and the second is a call to your UDF to compute the IDF. There's just one more step to determine the “important words.” Using TF-IDF, the important words are ones that don't appear often across all documents but do appear often in the current document. This is simply a product of the IDF and the TF. Consider the case of “is” with an IDF of 0.002 and a frequency of 50 in the document, versus “wizard” with an IDF of 1 and a frequency of 10. The TF-IDF for “is” computes to 0.1, compared to 10 for the term “wizard.” This gives Spark a better notion of importance than just the raw word count.
So far, you've used code to define the data frames. Let's try some SparkSQL. To compute the TF-IDF, you join the document frequency data frame with the inverse document frequency data frame and create a new column named termFreq_inverseDocFreq. Here is the SparkSQL:
var idfJoin = spark.Sql($"SELECT t.File, d.word, d.{docFrequency}, d.{inverseDocFrequency}, t.count, d.{inverseDocFrequency} * t.count as {termFreq_inverseDocFreq} from {nameof(documentFrequency)} d inner join {nameof(termFrequency)} t on t.word = d.word");
Explore the code to see how the final steps are implemented. These steps include:
All of the steps described so far provide a template or definition for Spark. Like LINQ queries, the actual processing doesn't happen until the results are materialized (such as when the total document count was computed). The final step calls Collect to process and return the results and write them to another CSV. You can then use the new file as input for the ML model. A portion of the file is shown in Figure 8.

Spark for .NET enabled you to query and shape the data. You built multiple data frames over the same data source and then joined them to gain insights about important terms, word count, and read time. The next step is to apply ML to automatically generate categories.
Predict Categories
The last step is to categorize the documents. The DocMLCategorization project includes the Microsoft.ML package for ML.NET. Although Spark works with data frames, data views provide a similar concept in ML.NET.
This example uses a separate project for ML.NET so that the model can be trained as an independent step. For many scenarios, it's possible to reference ML.NET directly from your .NET for Spark project and perform ML as part of the same job.
First, you must tag the class so that ML.NET knows which columns in the source data map to properties in the class. The FileData class uses the LoadColumn annotation like this:
[LoadColumn(0)]
public string File { get; set; }

[LoadColumn(1)]
public string Title { get; set; }
You can then create a context for the model and load the data view from the file that was generated in the previous step:
var context = new MLContext(seed: 0);
var dataToTrain = context.Data.LoadFromTextFile<FileData>(path: filesHelper.ModelTrainingFile, hasHeader: true, allowQuoting: true, separatorChar: ',');
ML algorithms work best with numbers, so the text in the document must be converted to numeric vectors. ML.NET provides the FeaturizeText method for this. In one step, the model:
- Detects the language
- Tokenizes the text into individual words or tokens
- Normalizes the text so that variations of words are standardized and cased similarly
- Transforms the terms into consistent numerical values or “feature vectors” that are ready for processing
The code in Listing 2 transforms columns into features and then creates a single “Features” column with the features combined.
Listing 2: Transforming text into features for machine learning.
var pipeline = context.Transforms.Text.FeaturizeText(
    nameof(FileData.Title).Featurized(),
    nameof(FileData.Title)).Append(context.Transforms.Text.FeaturizeText(nameof(FileData.Subtitle1).Featurized(),
    nameof(FileData.Subtitle1))).Append(context.Transforms.Text.FeaturizeText(nameof(FileData.Subtitle2).Featurized(),
    nameof(FileData.Subtitle2))).Append(context.Transforms.Text.FeaturizeText(nameof(FileData.Subtitle3).Featurized(),
    nameof(FileData.Subtitle3))).Append(context.Transforms.Text.FeaturizeText(nameof(FileData.Subtitle4).Featurized(),
    nameof(FileData.Subtitle4))).Append(context.Transforms.Text.FeaturizeText(nameof(FileData.Subtitle5).Featurized(),
    nameof(FileData.Subtitle5))).Append(context.Transforms.Text.FeaturizeText(nameof(FileData.Top20Words).Featurized(),
    nameof(FileData.Top20Words))).Append(context.Transforms.Concatenate(features, nameof(FileData.Title).Featurized(),
    nameof(FileData.Subtitle1).Featurized(),
    nameof(FileData.Subtitle2).Featurized(),
    nameof(FileData.Subtitle3).Featurized(),
    nameof(FileData.Subtitle4).Featurized(),
    nameof(FileData.Subtitle5).Featurized(),
    nameof(FileData.Top20Words).Featurized())
);
At this point, the data is properly prepared to train the model. The training is unsupervised, which means it must infer information with an example. You're not inputting sample categories into the model, so the algorithm must figure out how the data is interrelated by analyzing how features cluster together. You will use the k-means clustering algorithm. This algorithm uses the features to compute the “distance” between documents and then “draws” bounds around the grouped documents. The algorithm involves randomization so no two runs will be alike. The main challenge is determining the optimal cluster size for training. Different documentation sets ideally have different optimal category counts, but the algorithm requires you to input the number of categories before training.
The code iterates between two and 20 clusters to determine the optimal size. For each run, it takes the feature data and applies the algorithm or trainer. It then transforms the existing data based on the prediction model. The result is evaluated to determine the average distance of documents in each cluster, and the result with the lowest average distance is selected.
var options = new KMeansTrainer.Options
{
    FeatureColumnName = features,
    NumberOfClusters = categories,
};

var clusterPipeline = pipeline.Append(context.Clustering.Trainers.KMeans(options));
var model = clusterPipeline.Fit(dataToTrain);
var predictions = model.Transform(dataToTrain);
var metrics = context.Clustering.Evaluate(predictions);
distances.Add(categories, metrics.AverageDistance);
After training and evaluation, you can then save the optimal model and use it to make predictions on the data set. An output file is generated along with a summary that shows some metadata about each category and lists the titles underneath. The title is only one of several features, so sometimes it requires looking into the details to make sense of the categories. In local tests, documents such as tutorials end up in one group, API documentation in another, and exceptions in their own group.
The ML zip file can be used on new data in other projects with the Prediction Engine.
The machine learning model is saved as a single zip file. The file can be included in other projects to use with the Prediction Engine to make predictions on new data. For example, you could create a WPF application that allows users to browse to a directory and then loads and uses the trained model to categorize documents without having to train it first.
What's Next?
Spark for .NET is scheduled to GA around the same time as .NET 5. Read the roadmap and plans for upcoming features at https://aka.ms/spark-net-roadmap.
This walkthrough focused on a local development experience. To tap into the real power of big data, you can submit jobs to the cloud. There are a variety of cloud hosts that can accommodate petabytes of data and provide dozens of cores of computing power for your workloads. Azure Synapse Analytics is an Azure service that is designed to host large amounts of data, provide clusters for running big data jobs, and enable interactive exploration through notebooks and chart-based dashboards. To learn how to submit Spark for .NET jobs to Azure Synapse, visit https://aka.ms/spark-net-synapse.
Table 1: ML.NET machine learning tasks and scenarios
| Task | Example scenarios |
| Classification (text-based) | Categorize e-mail messages as spam or not spam `or` classify survey comments into different groups based on the content. |
| Regression | Predicting the price of a used car based on its make, model, and mileage or predicting sales of products based on advertising budgets. |
| Forecasting | Predicting future product sales based on past sales or weather forecasting. |
| Anomaly detection | Detecting spikes in product sales over time or detecting power outages. |
| Ranking | Predicting the best order to display search engine results or ranking items for a user's newsfeed. |
| Clustering | Segmenting customers. |
| Recommendation | Recommending movies to a user based on their previously watched movies or recommending products that are frequently bought together. |
| 'Image' classification | Categorizing images of machine parts. |
| Object detection | Detecting license plates on images of cars. |